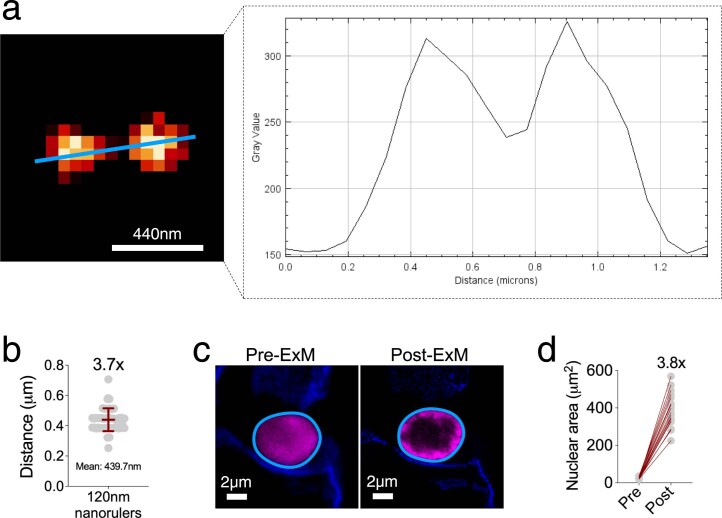
Extended Data Fig. 1. Quantification of expansion factor.
(a) Using the 120 nm nanorulers, we measured the distance between intensity peaks after expansion. (b) The mean distance (and SD) between 120 nm nanorulers was calculated, providing an average expansion factor of 3.7x (N = 50). The data is reported as mean ± SD. Then, we used nuclear stainings in tissues (c), the cross-sectional area of individual nuclei was calculated before and after expansion (d), providing an average expansion factor of 3.8x (N = 18).

