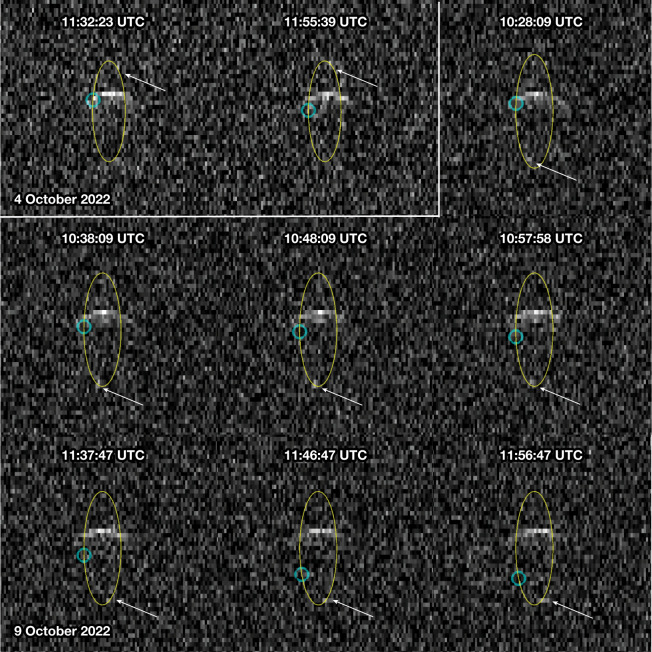
Fig. 2. Radar range-Doppler images of the post-impact Didymos system.
Radar range-Doppler images obtained on 4 October using Goldstone and 9 October using Goldstone to transmit and the Green Bank Telescope to receive. In each image, the distance from Earth increases from top to bottom and the Doppler frequency increases to the right, so rotation and orbital motion are anticlockwise. Each image was integrated for 20 min, with 10 min of overlap between successive images. Images have resolutions of 75 m × 0.5 Hz. The broader echo is from Didymos and the smaller, fainter echo shown using arrows is from Dimorphos. The open circles show Dimorphos positions predicted by the pre-impact orbit. The yellow ellipses show the trajectory of Dimorphos. Prediction uncertainties are smaller than the image resolution. On 4 October, the ellipse spans −870 m to +870 m along the y axis and −7 Hz to +7 Hz along the x axis, corresponding to line-of-sight velocity of −12 cm s−1 to +12 cm s−1. On 9 October, the ellipse spans −980 m to +980 m along the y axis and −8 Hz to +8 Hz along the x axis, corresponding to line-of-sight velocity of −14 cm s−1 to +14 cm s−1. The physical extents of the ellipse vary because of the viewing geometry.

