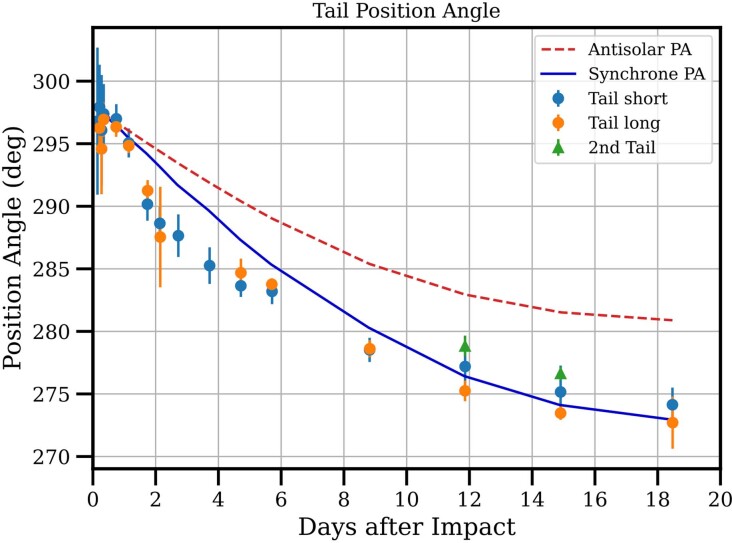
Extended Data Fig. 7. The position angles of the tail measured from HST images.
The blue circles are measured from the stacked images of the short exposures, and the orange circles are measured from the stacked images from the long exposures. The green triangles are the position angles of the secondary tail. The red dashed line is the antisolar direction, and the blue solid line is the position angle of synchrones for dust emitted at the time of impact. The tail orientation measured from the short exposures could be affected by the secondary tail due to the low signal-to-noise compared to the long exposures.

