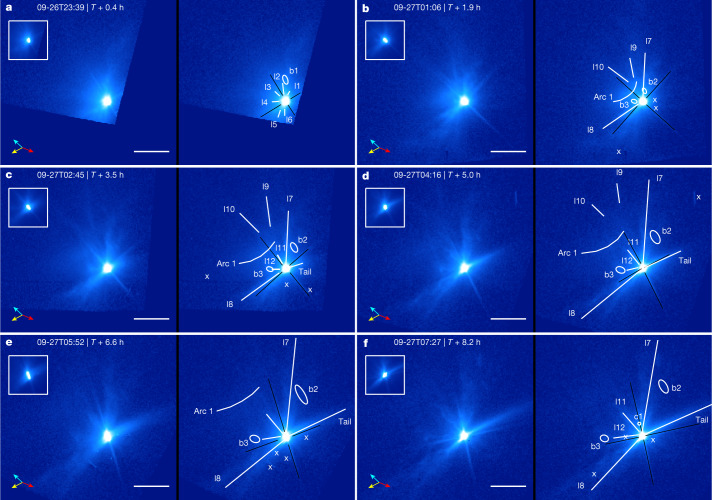
Fig. 2. Evolution of Dimorphos ejecta from T + 0.4 h to T + 8.2 h.
a–f, All images are displayed in duplicate pairs, with the left unannotated for clarity and the right annotated with features marked by white markers and labels. The inset in the top left of each panel is the 100-pixel-wide region centred on the asteroids but with the flux scaled down 10 times to show the details of the bright core. The symbol ‘x’ marks artifacts due to, for example, residual cosmic rays, frame boundaries, background objects and defective pixels. The times correspond to the mid-observation time of each image. Black lines mark diffraction spikes. All images are displayed with the same logarithmic brightness scale. Sky north is in the upward direction and the east is to the left. The yellow arrows point to the direction of the Sun, the cyan arrows the heliocentric velocity direction of Didymos and the red arrows the direction of the DART spacecraft at impact, all projected in the sky plane at the time of observation. The HST had a pointing drift during the exposures of some images, causing a smear of about 4–7 pixels in the first four images (before T + 5.0 h) and about 14 pixels in the T + 6.6 h image, all along the northeast–southwest direction (Methods). The drift widens the tail and the two diffraction spikes orthogonal to the direction of the drift. Most features are much larger than the length of the drift; we added uncertainties to account for the effect of this drift in our measurements. Many features are visible, including linear features (l1–l12), an arc (arc 1), a circular feature (c1), blobs (b1–b3) and a tail. The ejecta cone is marked by linear features l7 and l8. Scale bars are 200 km at the distance of Didymos.

