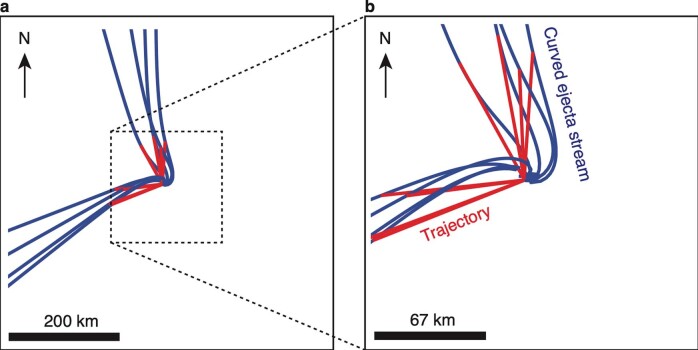
Extended Data Fig. 2. Illustration of curved ejecta streams seen by HST on T+2.1 days (Fig. 3d).
(a) The red lines represent the trajectories of eight dust particles ejected at 0.43 m/s, each involved in the northern or southern edges of the ejecta cone. The initial directions are based on the measured cone geometry (Methods). The trajectories are curved by the gravity of Didymos and Dimorphos. The curved dark blue lines are the locations of several particles ejected at different speeds along the same direction as the particle in each corresponding red curve, forming the observed curved ejecta streams. The area in the illustration is 600 km wide. (b) Same illustration as (a) but with a smaller scale, showing the more remarkable curvature in the ejecta streams near the binary system. These streams capture a snapshot of particles’ positions with initial ejection speeds less than <~ 1 m/s.

