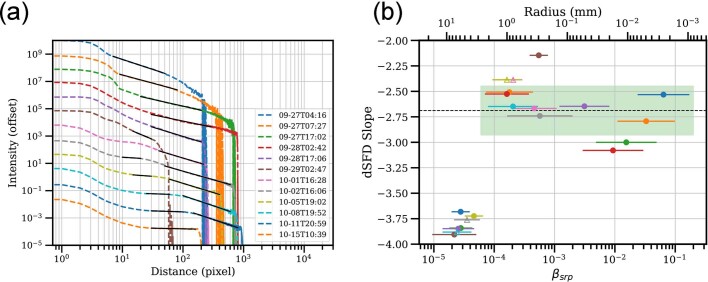
Extended Data Fig. 3. Tail brightness profile and ejecta particle size distribution.
(a) Brightness profiles along the tail from various images. The dashed lines are average surface brightness extracted along the tail with a width of 40 pixels (1.6”), offset vertically for clarity. The solid lines are corresponding best-fit power law models. Two sections are fitted separately for the profiles from the images collected on and after October 2, as described in the text. (b) Best-fit power law index for the differential size distribution (dSFD) of ejecta dust particles with respect to βsrp on the bottom axis and the corresponding particle radius (assuming a density of 3500 kg/m3) on the top axis. Filled circles are derived from the main tail, open triangles from the secondary tail. The horizontal error bars represent the range of βsrp covered by the corresponding tail profile. The colors of symbols correspond to the colors of profiles in panel (a). The slope values from the outer section have βsrp higher than 1x10⁻⁴, and those from the inner section correspond to βsrp between 1x10⁻⁴ and 1x10⁻⁵. The dashed horizontal line is the average −2.7 for the outer sections, and the green shaded area represents the standard deviation.

