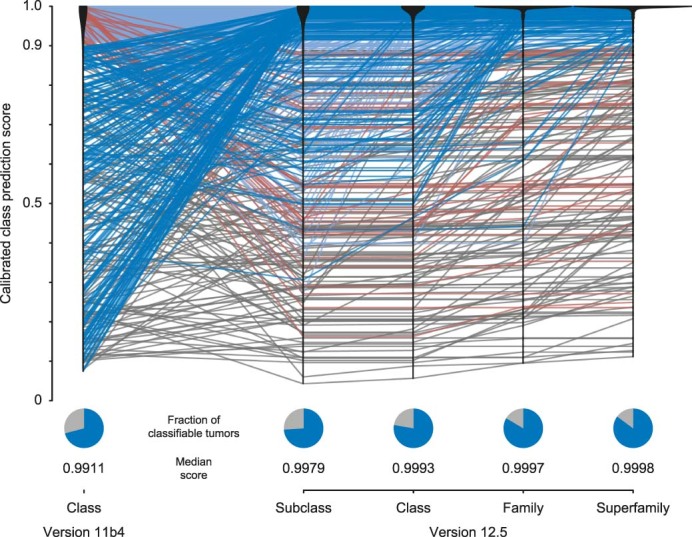
Extended Data Fig. 10. Advancement of automated DNA methylation class prediction.

Calibrated class prediction scores of random forest-based DNA methylation class prediction in version 11b4 and prediction scores for DNA methylation levels: subclasses, classes, class families, and superfamilies in version 12.5 (upper panel). Every line represents one tumor; light blue: classifiable by both versions; dark blue: classifiable by version 12.5 only; red: classifiable by version 11b4 only; grey: non-classifiable by both versions. Black violin plots represent density estimates for each version and level. Pie charts (lower panel) indicate the fractions of classifiable tumors (calibrated scores ≥ 0.9, blue) and unclassifiable tumors (calibrated scores < 0.9, grey) by each version and level. See Supplementary Table 1 for underlying data.
