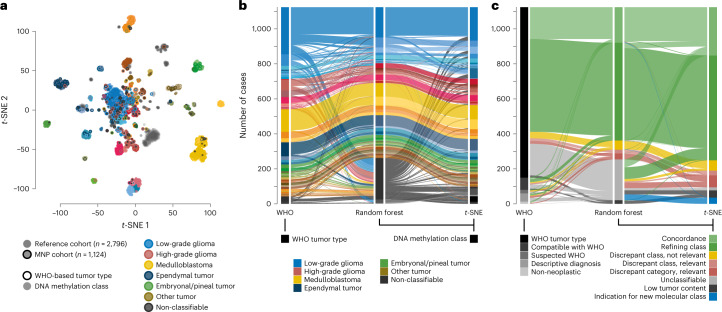
Fig. 3. Landscape of DNA methylation classes and levels of concordance with WHO-based diagnosis.
a, t-SNE analysis of DNA methylation data from the study cohort alongside 89 published DNA methylation classes4. Each tumor from the study cohort is represented by a circle indicating assigned DNA methylation class (fill) and WHO-based tumor type (outline). b, Comparison of WHO-based tumor types and DNA methylation classes assigned by RF-based class prediction and t-SNE analysis. Colors in a and b correspond to tumor types and classes as indicated in Fig. 1 and Extended Data Fig. 1. c, Comparison of certainty levels of WHO-based diagnoses and concordance with DNA methylation classes assigned by RF-based class prediction and t-SNE analysis. See Supplementary Tables 1 and 4 for underlying data.

