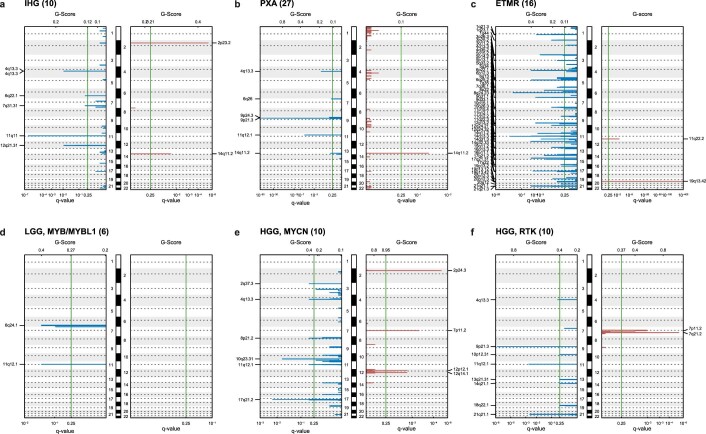
Extended Data Fig. 4. Significant regions of DNA copy number alterations by DNA methylation class.
Plots show the q-values (x-axes, indicating the false discovery rate) determined by GISTIC2.0 with respect to significant lost (blue) and gained (red) genomic regions among the human chromosomes 1 to 22 (hg19) in DNA methylation classes ‘infantile hemispheric glioma’ (a), ‘pleomorphic xanthoastrocytoma’ (b), ‘embryonal tumor with multilayered rosettes’ (ETMR, c), ‘low-grade glioma, MYB/MYBL1-altered’ (d), ‘high-grade glioma, MYCN’ (e), and ‘high-grade glioma, pediatric RTK’ (f). Numbers in brackets indicate sample size for each class. Green lines indicate the significance threshold of q-value < 0.25. The cytobands of significantly altered regions are denoted on the y-axes. See Supplementary Table 2 for a detailed overview of significantly amplified/deleted regions across all DNA methylation classes.

