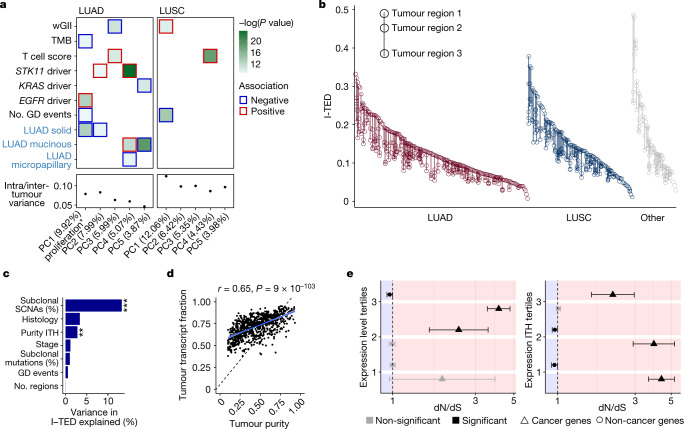
Fig. 1. Expression diversity in the TRACERx 421 cohort.
a, Relationship between PCs of transcriptomic diversity and genomic (black labels) and clinical (blue labels) variables. Displayed are the top PCs within LUADs (n = 480 regions from 190 tumours) and LUSCs (n = 303 regions from 119 tumours) that together explain at least 30% of the total variance, alongside their median ratio of heterogeneity (intratumour heterogeneity of PC activity divided by intertumour heterogeneity of PC activity). The colour of the border around each square indicates the direction of the association between each covariate and PC. In total, 39 variables were tested (Methods). Significance was determined using a mixed-effects linear model with purity as a fixed covariate and tumour as a random variable. Only features significant (P < 0.05) after FDR correction with at least one PC are displayed. *PC1 in LUAD was strongly negatively associated with the expression of hallmark gene sets related to proliferation (Extended Data Fig. 1f, Methods). GD, genome doubling; TMB, tumour mutational burden; wGII, weighted genome instability index. b, I-TED, calculated as the mean normalized gene expression correlation distance for a given region paired with every other region from the same tumour, displayed by histology. c, Proportion of variance in I-TED explained by selected genomic and clinical features from a linear model using 260 tumours with at least 2 primary tumour regions, and purity and genome instability estimates. Histological types represented by only a single tumour were excluded to ensure a sufficiently large sample size to estimate the effect of histology. **P = 0.003, ***P = 5.15 × 10⁻¹⁰. d, ASCAT-derived tumour purity and RNA estimate of the tumour transcripts fraction. Each dot represents one tumour region. A modified version of ASCAT50 was used to estimate the proportion of tumour and non-tumour cells within an admixed sequencing sample. e, dN/dS, inferring positive and negative selection of truncating somatic mutations, for cancer genes and non-cancer genes, by tertiles of median gene expression across the cohort (left) and by tertiles of gene expression ITH across the cohort (right). Dots represent the estimated dN/dS and the error bars represent the 95% confidence intervals calculated using the genesetdnds function in R from the package dNdScv. A dN/dS estimate is considered significant if the 95% confidence intervals do not overlap 1. Expression level tertiles contained 76, 24 and 9 cancer genes, and 4,856, 5,100 and 5,166 non-cancer genes, for tertiles 3, 2 and 1, respectively. Expression ITH tertiles contained 54, 24 and 31 cancer genes and 4,994, 5,082 and 5,046 non-cancer genes, for tertiles 3, 2 and 1, respectively. Median expression levels and expression ITH were based on the total number of tumour samples collected at surgical resection from tumours with more than one sample at that time point (n = 845 regions from 283 tumours).

