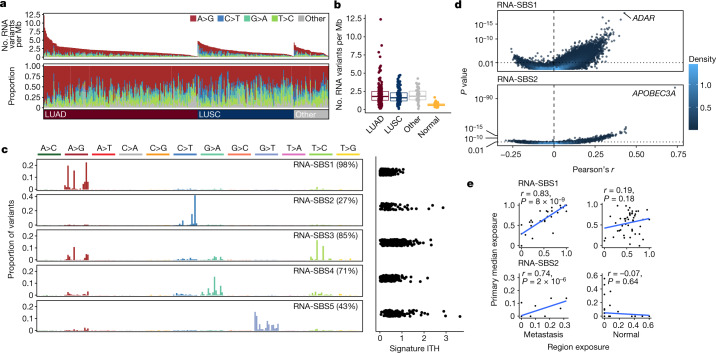
Fig. 3. RNA-SBS signatures in NSCLC.
a, RNA-editing overview (from top to bottom): number and type of RNA substitutions per Mb per primary tumour, tumours are sorted from left to right by histological subtype and by number of substitutions; proportion of each editing type per tumour; NSCLC histological subtype per tumour. b, Number of RNA substitutions detected per tumour by histological subtype of NSCLC and in normal adjacent lung tissue. LUAD, n = 190; LUSC, n = 119; Other, other subtypes, n = 43; Normal, tumour-adjacent normal lung tissue, n = 96. Boxes represent the lower quartile, median and upper quartile. c, Left, trinucleotide profile of each RNA-SBS signature (left). Only samples from patients with more than 20 RNA variants were considered, n = 333. Right, signature ITH measured as standard deviation of each signature exposure across tumour regions divided by the mean exposure of each signature across the cohort, based on 280 tumours with more than 20 RNA variants and more than one region. The percentage of tumours with signature activity in at least one primary region is indicated in parentheses. d, Volcano plot showing the Pearson’s r correlations between the number of RNA-SBS1 (top) or RNA-SBS2 (bottom) substitutions with the expression of all genes in the transcriptome. P values were calculated using a linear mixed-effects model, using the tumour of origin of each region as random effect. P values were adjusted for repeated measures. Correlations were based on 765 primary tumour regions with at least 20 RNA variants from 329 tumours. Colour indicates dot density, with light coloured points belonging to areas of high density in the plot. e, Correlation between the exposure of RNA-SBS signatures within tumour-adjacent normal lung tissue and their respective primary tumour regions, and metastatic tumour regions and their respective seeding regions in the primary tumour. Primary tumour exposure was calculated as the median exposure across all primary regions for the comparison with tumour-adjacent normal tissue, and across all seeding regions for the comparison with metastases. Only primary–metastasis pairs where more than 20 RNA substitutions were detected in the metastasis and primary region were used (n = 50 pairs for normal samples, n = 31 for metastases). P values were computed with a two-sided t test testing the null hypothesis that the Pearson correlation coefficient r = 0.

