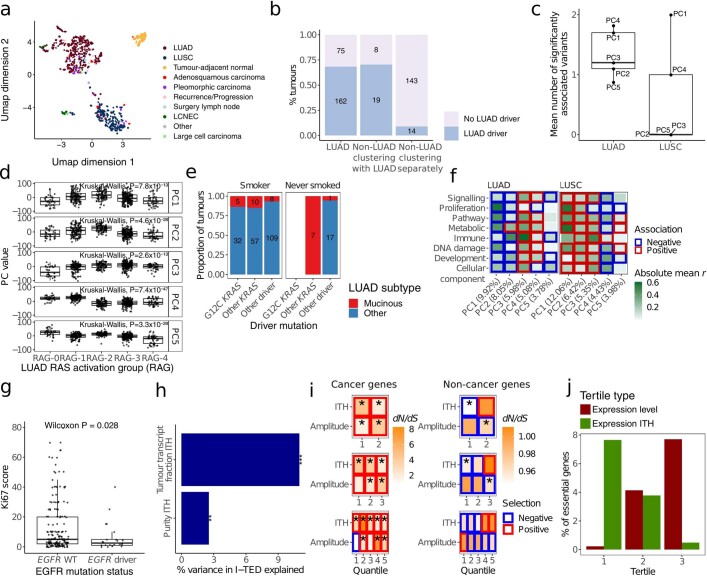
Extended Data Fig. 1. Patterns of expression diversity in the TRACERx cohort.
a. Uniform manifold approximation and projection (UMAP) showing the distribution of each primary tumour region in the cohort based on gene expression. n = 914 tumour regions collected at surgical resection from 352 primary tumours, n = 33 recurrence/relapse samples from 24 tumours and n = 96 paired normal samples from 96 tumours. LUAD: Lung adenocarcinoma; LUSC: Lung squamous cell carcinoma; LCNEC: Large cell neuroendocrine carcinoma. b. Percentage of tumours with and without ‘LUAD drivers’ (driver mutations enriched in LUADs) in LUAD, non-LUADs clustering with LUADs in the UMAP and non-LUADs clustering apart from LUADs. Number of tumours within each category is annotated. c. Mean number of variables significantly associated with each principal component (PC) of gene expression after randomly sub-sampling the number of LUAD regions to match that of LUSC regions (n = 303) for 50 iterations. LUAD subtypes were not included in this comparison to ensure an equal number of variables between LUAD and LUSC. d. PC associations with each of the different RAS activation groups (RAG) developed by East and colleagues11. PC activity different significantly between RAGs. Analysis based on 480 tumour regions collected at surgical resection from 190 LUAD tumours where RAG could be estimated. e. Proportion of LUAD tumours in smokers (comprising current and ex-smokers) and never smokers, split by LUAD subtype, with either G12C KRAS driver mutations, non-G12C KRAS driver mutations or driver mutations in other genes. Numbers annotated indicate the number of tumours per category. f. Pearson’s r between each PC and functional groups comprising the fifty MSigDb Hallmark gene sets14. Pearson’s r values were averaged within the functional group to which each hallmark was assigned14 across LUAD, n = 480 tumour regions from 190 tumours; and LUSC, n = 303 tumour regions from 119 tumours. The colour of the border around each square indicates the direction of the association between each covariate and PC for significant (FDR<0.05) associations. Significance was determined through a mixed effects linear model using purity as a fixed covariate and tumour as a random variable; P values were calculated by hallmark and combined within MSigDB functional group using the harmonic mean. g. Immuno-histochemical staining for Ki67 proliferation marker in LUAD tumours with and without EGFR driver mutations. Only the 196 LUAD tumours within which Ki67 was measured are displayed. Significance was calculated through a two-sided unpaired Wilcoxon test. WT: Wild type. h. Percentage of variance in Intra-Tumour Expression Distance (I-TED) that was explained by intra-tumour variance in tumour transcript fraction and intra-tumour variance in tumour purity, in a linear regression. Analysis based on 258 tumours with at least two primary tumour regions, and purity and tumour transcript fraction estimates. ***:P value = 5.03 × 10⁻⁸; **:P value = 0.007. i. dN/dS in non-cancer and cancer genes for different quantiles of ITH or expression amplitude. Asterisks indicate significance whereby the 95% confidence interval of the dN/dS estimate did not overlap 1 signalling either negative (blue square) or positive (red square) selection. Broadly, lower quantiles of ITH tended towards negative selection in non-cancer genes, whereas the opposite was true for cancer genes. Results based on bootstrapping from the total number of tumour samples resected at surgery of the primary tumour from tumours with more than one sample at that time point, 845 regions from 285 tumours. j. Percentage of all essential genes from the Project Achilles list18 (n = 604) in lung cancer for tertiles of expression ITH or amplitude. All box plots in this figure represent lower quartile, median and upper quartile, whiskers represent lower/higher bound +/− 1.5 x interquartile range.

