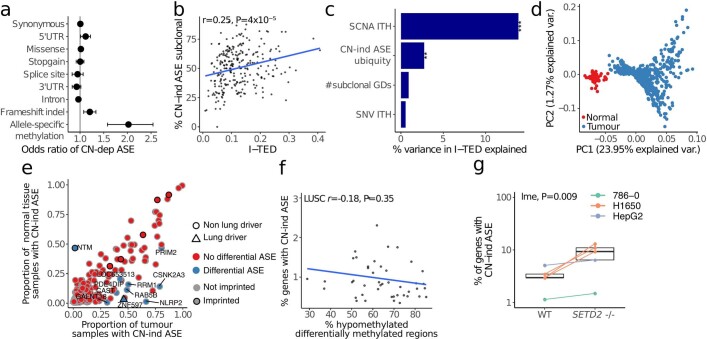
Extended Data Fig. 2. Genomic and transcriptomic links with allele-specific expression.
a. Points indicate odds ratio estimates for copy-number dependent allele-specific expression (CN-dependent ASE) when somatic point mutations, or allele-specific methylation (where both RRBS and RNA-Seq were available) were concomitantly detected in the same gene, by type of alteration. Bars indicate 95% confidence intervals. Odds ratio for the links between CN-dependent ASE and mutations; and CN-dependent ASE and ASM are based on 876 primary tumour regions from 332 tumours, and 96 tumour regions from 31 tumours, respectively. b. Relationship between the proportion of CN-independent ASE in a tumour that is subclonal, being found in a subset of regions within a given tumour, and intra-tumour expression diversity. The Pearson correlation coefficient is shown (r = 0.25, P = 4 × 10⁻⁵). c. Percentage of variation in I-TED that was explained by single nucleotide variant (SNV), SCNA and CN-independent ASE ITH, as well as the number of subclonal whole genome duplication events (GDs) per tumour. The linear regression was based on 269 tumours where all variables could be calculated. ***:P = 2.4 × 10⁻¹⁰; **:P = 0.004. d. PCA of CN-independent ASE patterns in TRACERx421 tumours (n = 877 tumour regions) and normal tissue (n = 95) samples where CN-independent ASE could be estimated. Samples are coloured by tissue type. Values within parentheses on the axes indicate the proportion of variance explained by each principal component. e. Genes with CN-independent ASE in either tumour or normal tissue samples. Genes with an enrichment of CN-independent ASE in tumours are marked in blue, lung cancer genes are represented by triangles and imprinted genes have a black outline. Enrichment was defined as FDR < 0.05 from a Fisher’s exact test per gene. The number of regions used to calculate enrichment varied per gene between 5 and 850 (median = 164) for tumours and between 5 and 95 (median = 35) for normal tissue. f. Relationship in LUSC between the proportion of evaluable genes with CN-independent ASE and the ratio of differentially hypo-methylated clusters of neighbouring CpGs compared to all differentially methylated genomic positions. The Pearson correlation coefficient is shown; P value was calculated using a linear mixed-effects model with tumour as random variable (r = −0.18, P = 0.35). g. Percentage of evaluable genes affected by CN-independent ASE in wild type (WT) and SETD2 deficient isogenic cell lines. Expression data was obtained from publicly available datasets from three separate studies in three different cell lines23–25: in total, data from 10 cell lines across 3 experiments (n = 6, 2 and 2). Boxes represent lower quartile, median and upper quartile. P values were calculated using a linear mixed effects model, using the study of origin of each sample as a random effect. SETD2-/-: inactivation of the SETD2 gene.

