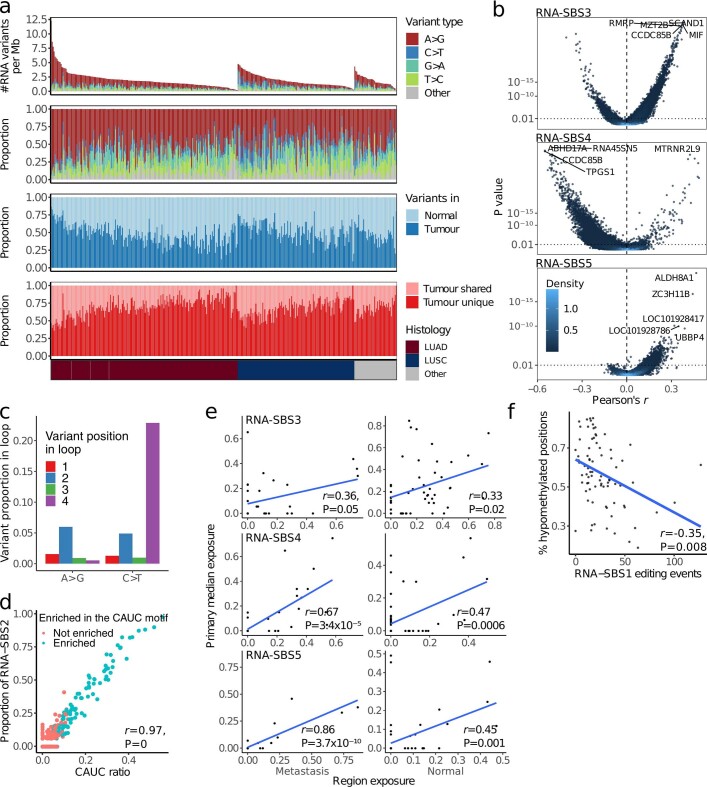
Extended Data Fig. 3. Patterns of RNA variant diversity in TRACERx.
a. Overview of RNA substitutions in the primary tumour lung TRACERx cohort, from top to bottom: Number and type of RNA variants per megabase per tumour, tumours are sorted from left to right by histological subtype and by number of variants; Proportion of each variant type per tumour; Proportion of variants present in any of the normal samples; Proportion of tumour-specific RNA variant sites shared across at least two tumours. NSCLC histological subtype per patient. LUAD, lung adenocarcinomas, n = 190; LUSC, lung squamous cell carcinomas, n = 119; Other, other subtypes, n = 43; tumour-adjacent normal lung tissue, n = 96. b. Volcano plots showing Pearson correlations between the number of RNA variant signature substitutions and gene expression for all genes in the transcriptome, split by RNA single-base substitution (SBS) signature. P values were calculated using a linear mixed effects model, using tumour of origin of each region as random effect. The genes with the 5 most significant correlations with each signature are labelled. P values were adjusted for repeated measures. Correlations were based on 765 primary tumour regions with at least 20 RNA variants from 329 tumours. Colour indicates dot density, with light coloured points belonging to areas of high density in the plot. c. Proportion of RNA variants relative to variant type (A>G or C>T) in 4nt RNA loops. C>T substitutions were more prevalent in the 4th nucleotide of 4nt RNA hairpin loops, consistent with APOBEC RNA editing activity. d. Proportion of substitutions assigned to RNA-SBS2 activity compared to the proportion of RNA variants at CAT[C>T] motif sites per tumour region (CAUC ratio). Blue dots represent regions where RNA editing at these motifs was enriched (Fisher’s test P<0.05 for C>T substitutions at each site compared to C sites in a 40nt genomic region). P values were computed based on a two-sided t test testing the null hypothesis that the Pearson correlation coefficient (r) = 0, within 892 tumour regions and 77 tumour-adjacent normal tissue samples with at least 10 C>T variants. e. Pearson correlation between the exposure of RNA-SBS signatures within metastatic tumour regions and their respective seeding regions in the primary tumour (left); and tumour-adjacent normal lung tissue and their respective primary tumour regions (right). Primary tumour exposure was calculated as the median exposure across all primary regions for the comparison with normal tumour-adjacent tissue, and of all seeding regions for the comparison with metastases. Only primary-metastasis pairs where more than 20 RNA substitutions were detected in the metastasis and primary region were used (n = 50 pairs for normals, n = 31 for metastases). P values were computed based on a two-sided t test testing the null hypothesis that the Pearson correlation coefficient = 0. f. Pearson correlation between the activity of RNA-SBS1 and the global levels of methylation in a tumour region (measured as the percentage of all differentially methylated positions that are differentially hypomethylated clusters of neighbouring CpGs). Methylation data and sufficient RNA substitutions for signature deconvolution were available for 80 regions from 31 tumours. P values were calculated using a linear mixed effects model, using tumour of origin of each region as a random effect.

