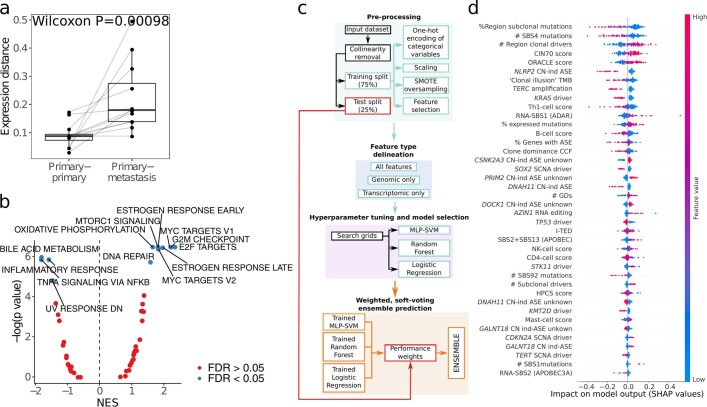
Extended Data Fig. 4. Transcriptional features of metastasis.
a. Expression distance between paired primary tumour regions; compared to distance between paired primary and non-LN intrathoracic metastatic tumour regions. Only patients with two or more primary regions and at least one metastatic region sampled are shown (12 primary-metastasis pairs from 8 tumours). Boxes represent lower quartile, median and upper quartile, whiskers represent lower/higher bound +/− 1.5 x interquartile range. Significance was tested using a paired Wilcoxon test (P = 0.00098). b. Gene set enrichment analysis (GSEA) of functional groups from hallmark gene sets14 between metastasis seeding and non-seeding regions. Only tumours where both seeding and non-seeding regions had RNA-seq were included (n = 37, 122 regions). Dots coloured by a significant enrichment after FDR correction. Mean normalised enrichment score (NES) is displayed on the x-axis and indicates the enrichment for a given gene set, and the negative log of the adjusted P value is displayed on the y-axis. c. Overview schematic of the machine learning framework used to predict whether a region contains a metastasis-seeding clone(s). MLP-SVM: multilayer-perceptron with support vector machine terminal layer. d. Individual Shapley Additive Explanations (SHAP) values for the most important features across the combined ensemble. Positive SHAP values indicate weighting towards a prediction of metastasis seeding whereas negative SHAP values indicate a weighting towards prediction of metastasis non-seeding. Colour scale represents the value of the feature across the test dataset (red=high values, blue=low values). For instance, high values of the ORACLE expression marker (red dots) were associated with a higher likelihood of a region being seeding (positive SHAP values) in the combined ensemble. The predictions were based on 516 primary tumour regions from 206 tumours where seeding status could be established and where all metrics tested could be measured (307 non-seeding regions, 209 seeding), with a 75%-25% training-test dataset split. TMB: tumour mutational burden; CN-ind ASE: Copy number-independent allele specific expression; HPCS: High Plasticity Cell State5; GD: genome doubling; CCF: cancer cell fraction; Clone dominance CCF: maximum CCF at terminal nodes of a phylogenetic tree; SCNA: somatic copy number alteration.

