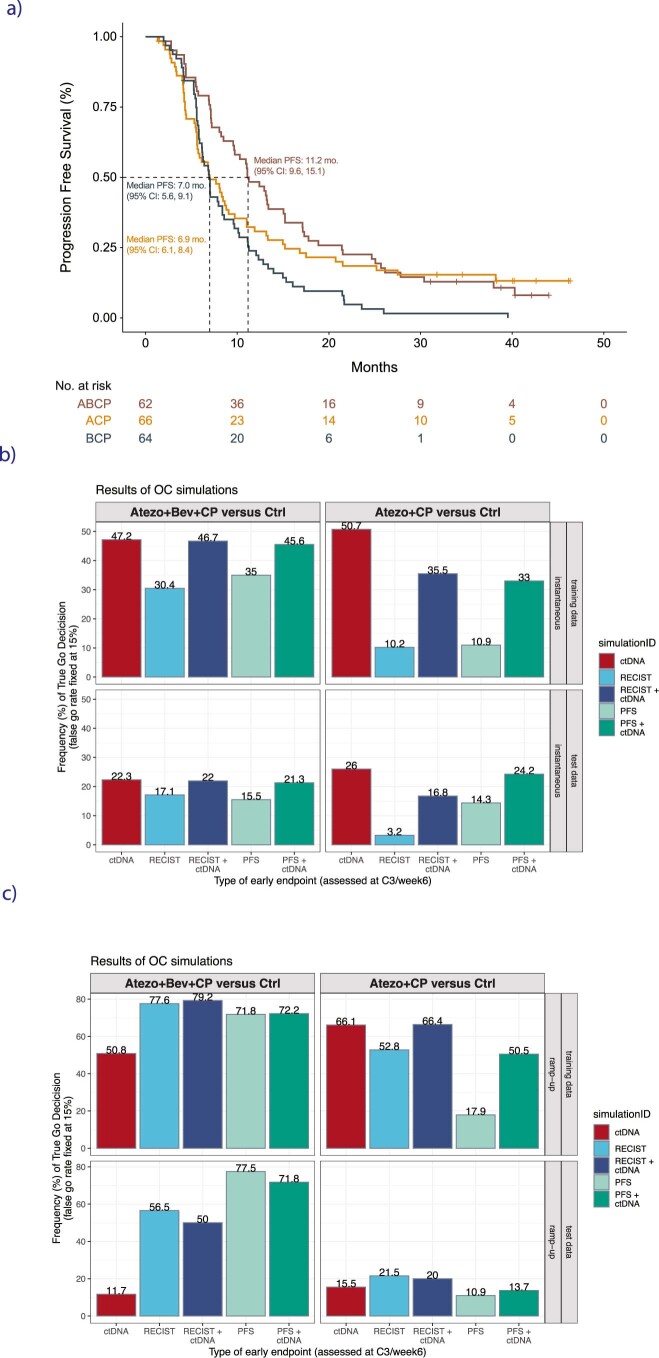
Extended Data Fig. 6.
(a) KM curve showing PFS in the test dataset for the three arms in the IMpower150 trial including ABCP (brown), ACP (orange), and control arm BCP (black, control arm). (b–c) Complete results of operation characteristics simulations showing the rate of true ‘Go’ decisions in (b) instantaneous enrollment scenario (every patient has their clinical data cut at their respective C3D1 time point), versus (c) ramp-up enrollment scenario (use all clinical data available for patient after last patient enrolls, so some patients could have additional radiographic data available after the week 6 time point). Training data shown in top rows, test data shown in bottom rows. The early endpoint is either ctDNA criteria alone (red bar), RECIST criteria alone (light blue) or RECIST criteria combined with ctDNA (dark blue), PFS alone (light green bar) or PFS combined with ctDNA criteria (dark green bar).

