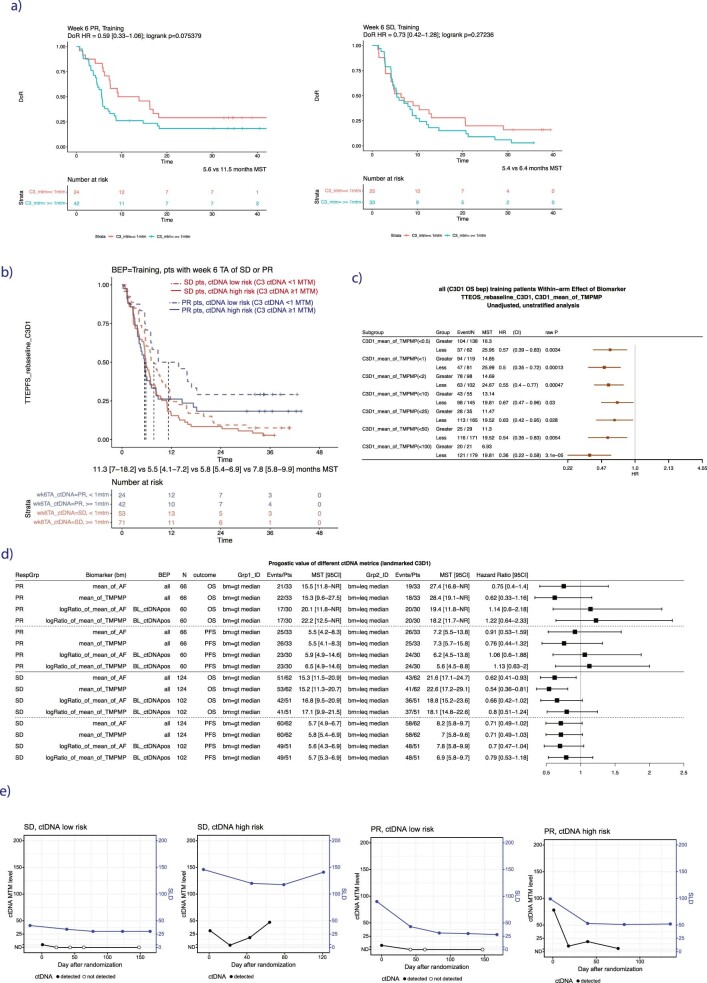
Extended Data Fig. 3.
(a) KM analysis for duration of treatment response (DoR) in patients with PR (left) or SD (right) at week 6 tumor assessment who are risk stratified using ctDNA levels above or below 1 MTM, in training. (b) KM analysis for PFS in patients with SD or PR at week 6 tumor assessment who are risk stratified using ctDNA levels above or below 1 MTM, in training. (c) Forest plot showing prognostic value of other thresholds of MTM splits at C3D1 timepoint for risk stratification for OS in entire training dataset. Note that here MTM is labeled mean_of_TMPMP (for mean tumor molecules per ml plasma). HRs are comparing patients with MTM level below (‘Less’) versus above (‘Greater’) each threshold for splitting C3D1 MTM, where the number of patients can be found in the third column (‘N’). MST indicates median survival time. Points and error bars indicate HR and 95% confidence interval, respectively. Univariable Cox proportional-hazards model was used to estimate HR and logrank test to report P values. (d) Forest plot showing prognostic value of other ctDNA metrics for OS and PFS in PR and SD patients in training. Note that here MTM is labeled mean_of_TMPMP (for mean tumor molecules per ml plasma). HRs are comparing patients with feature values ≤ versus > than the median value for that feature. RespGrp column indicates whether the subset for the risk stratification analysis is the PR or SD patients. BEP column indicates ‘biomarker evaluable population’, meaning the subset of patients included in the analysis, which is either ‘all’ patients (for features summarizing ctDNA levels), or for patients who are ctDNA positive at the baseline time point (‘BL_ctDNApos’, for features summarizing ctDNA change). Outcome column indicates if the HR is for OS or PFS. MST indicates median survival time. Points and error bars indicate HR and 95% confidence interval, respectively. (e) Four example patient time courses showing longitudinal ctDNA MTM level and tumor size by SLD for 4 example patients.

