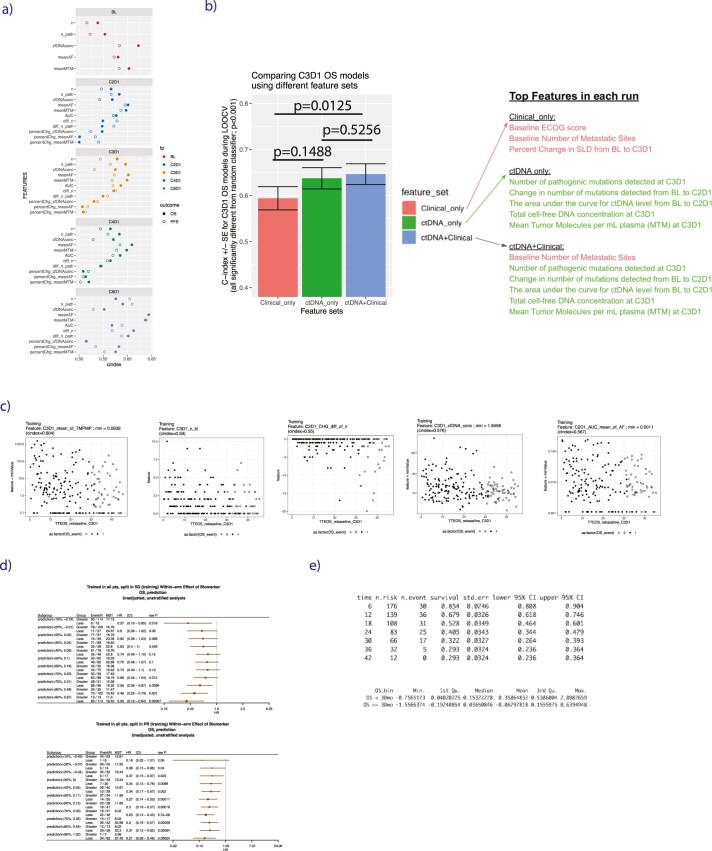
Extended Data Fig. 4.
(a) Scatterplots showing the univariable rank concordance (c-index, x axis) for each individual ctDNA feature for landmarked OS and PFS estimated at each time point (panels), in training. ‘n’ indicates number of detected variants’, ‘n_path’ indicates number of detected known/likely pathogenic variants, ‘percChg’ and ‘diff’ indicate percent change and difference in ctDNA level from baseline. (b) Comparison of models trained using either clinical features alone (red), ctDNA features alone (green), or ctDNA+Clinical features (blue), with annotation as to which metrics were top features in each run. The bar height is rank concordance (c-index) calculated from leave-one-out-cross-validation (LOOCV) to fit an elastic net model, error bars are standard error of the c-index, P values are two-sided and based on a U-statistic to compare two predictors. Models were built using n = 206 patients in the training subset at-risk for an OS event at C3D1. (c) Scatterplots for the 5 top features from C3D1 OS model, showing the association between each feature value with landmark OS. (d) Forest plots showing prognostic value of C3D1 OS ctDNA model predictions in training data for patients with SD (top forest plot) and Partial Response (bottom forest plot), where the number of patients can be found in the third column (‘N’), ‘MST’ indicates median survival time. Points and error bars indicate HR and 95% confidence interval, respectively. Univariable Cox proportional-hazards model was used to estimate HR and logrank test to report P values. Note that the threshold chosen for categorizing a patient as having molecular progressive disease (mPD) was done by taking the mean of the optimal split in SD patients (75th percentile, top forest plot) and the optimal split in PR patients (70th percentile, bottom forest plot). (e) Choosing a threshold in training data of C3D1 OS ctDNA model predictions for categorizing a patient as having mResp was done by identifying the patients in training data who achieved durable OS of ≥ 30 months (which was 32.2% of the population, see top table), and then taking the median prediction score of this population (which was 0.036, see bottom table) in training data.

