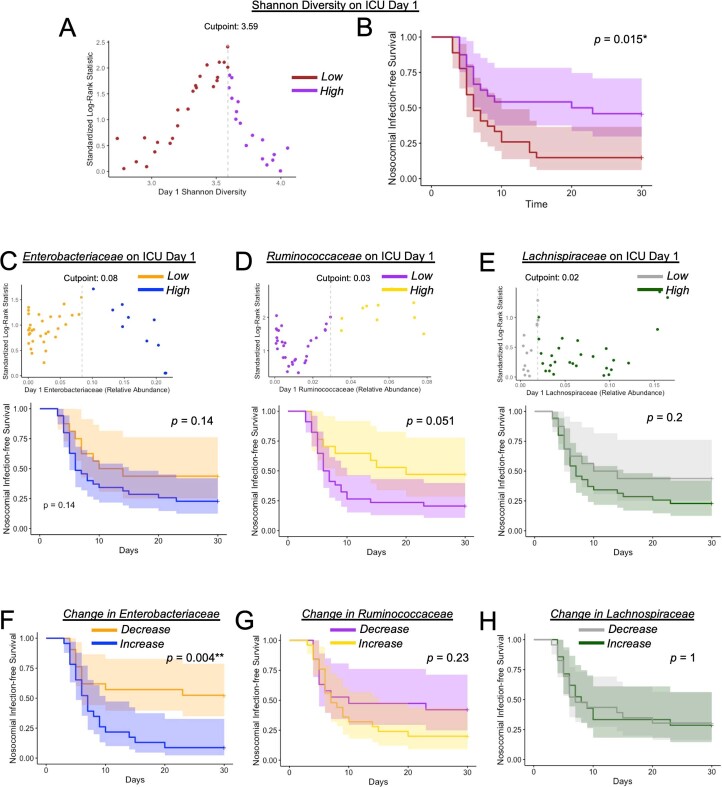
Extended Data Fig. 3. Microbiota dynamics and nosocomial infection-free survival in critical illness.
(a) Maximally selected rank statistics identified that a Shannon diversity index value of 3.59 on day 1 of admission yielded the greatest separation of patients based on nosocomial infection-free survival. Patients with Shannon index above this cutoff (>3.59) were grouped as ‘high’ Shannon index, and those below cutoff (<3.59) were grouped as ‘low’ Shannon index. (b) Kaplan–Meier curve of nosocomial infection-free survival between patients with high Shannon diversity or low Shannon diversity as determined in (A). (c–e) Maximally selected rank statistics identified relative abundance values on day 1 of ICU admission of (C, top) Enterobacteriaceae, (D, top) Ruminococcaceae, and (E, top) Lachnospiraceae that yielded the greatest separation of patients based on nosocomial infection-free survival. Patients with relative abundance values above the cutoff were grouped as ‘high’, and those below cutoff were grouped as ‘low’ for each respective bacterial family. (Bottom panels) Kaplan–Meier curves of nosocomial infection-free survival between patients with high versus low relative abundance of (C, bottom) Enterobacteriaceae, (D, bottom) Ruminococcaceae, and (E, bottom) Lachnospiraceae. (f–h) Kaplan–Meier curves of nosocomial infection-free survival in patients stratified by the change in relative abundance between day 1 and 3 of ICU admission (increase vs decrease) of (F) Enterobacteriaceae, (G) Ruminococcaceae, and (H) Lachnospiraceae. Statistical analysis was performed using log-rank test, p values as shown.

