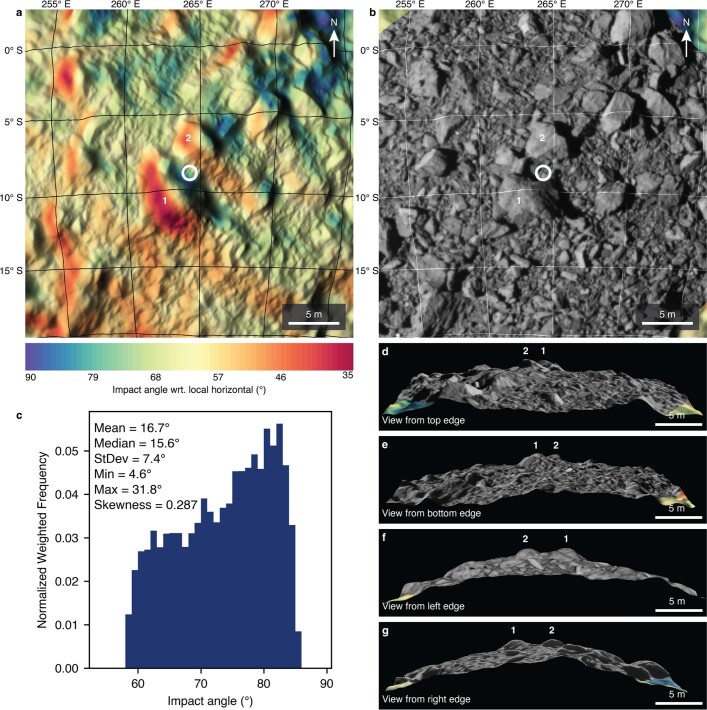
Extended Data Fig. 2. Tilts and topography at the impact site.
DTM of the DART impact site with facets colored by the impact angle with respect to local horizontal, averaged over a 3-m region. The DTM is lit to match the lightning in DRACO images at the time of impact. The white circle shows the uncertainty in the impact location (a circle with a radius of 68 cm). Boulders 1 and 2 correspond to boulders 1 and 2 in Fig. 2. (b) The same DTM with DRACO image dart_0401930048_45552_01_iof.fits draped over it. The image does not cover the entire DTM, so the corners of panel b show the impact angle plate coloring. (c) Histogram of tilts within the white circle representing the uncertainty in the impact site location. (d) – (g) Perspective views of the impact site DTM with overlaid image shown in (b), i.e., the DTM in panel (b) viewed edge on from each of the four sides of the DTM. Boulders 1 and 2 are prominent, as is the small niche between them in which the spacecraft bus hit the surface.

