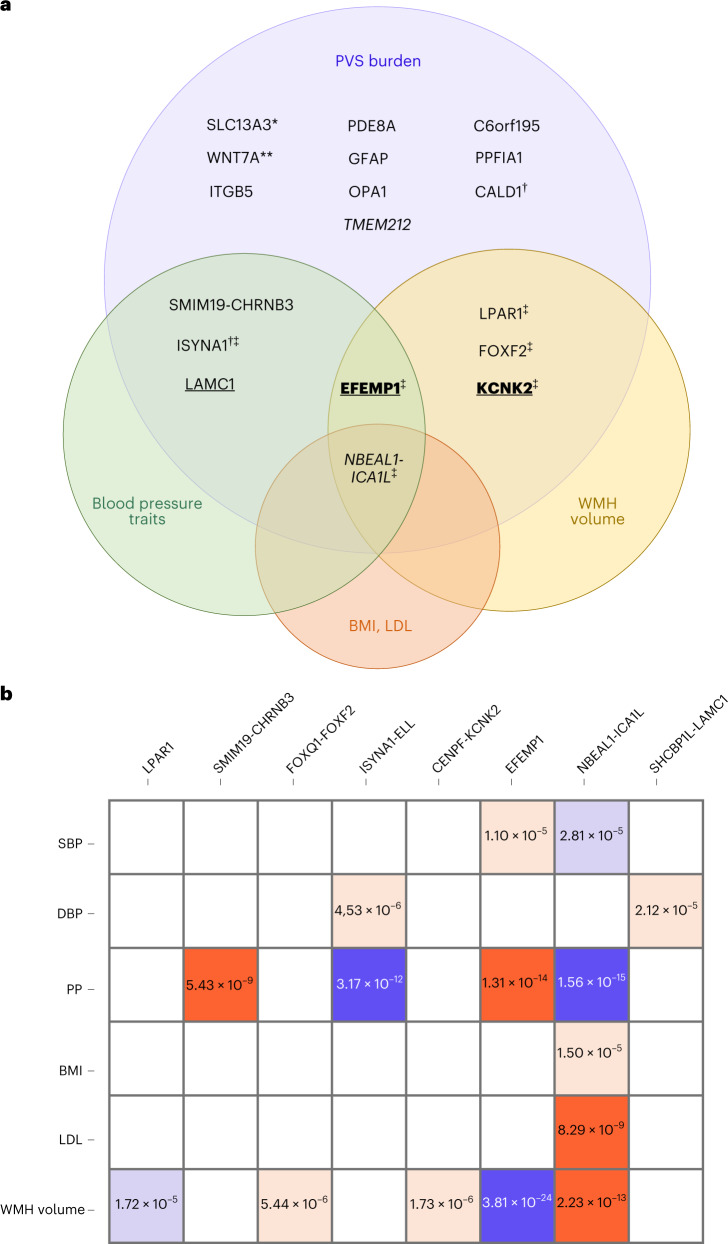
Fig. 2. Association of PVS loci with vascular risk factors and other MRI markers of cSVD.
a, Venn diagram displaying significant association of genome-wide significant risk loci for PVS burden with vascular risk factors and other MRI markers of cSVD: in italics for BG-PVS; underlined for HIP-PVS; underlined and in bold for HIP- and WM-PVS; all others for WM-PVS only (P < 3.3 × 10⁻⁵, two-sided, correcting for multiple testing (21 independent phenotypes, 3 PVS locations and 24 independent loci)); *6 independent loci; **2 independent loci; †genome-wide significant in Europeans only; ‡in colocalization analyses the posterior probability PP4 was higher than 75% for these loci (only with WMH at NBEAL1-ICA1L). Exact P values are provided in Supplementary Table 16. b, Direction of association and level of significance of pleiotropic SNPs displayed in a: in red when the risk allele for extensive PVS burden is positively associated with the trait, in blue when the PVS risk allele is negatively associated with the trait (unexpected direction), in dark red and dark blue for genome-wide significant associations and in light red and light blue for significant association after multiple-testing correction (P < 3.3 × 10⁻⁵, two-sided, correcting for multiple testing (21 independent phenotypes, 3 PVS locations and 24 independent loci)). PP, pulse pressure; BMI, body mass index; LDL, LDL cholesterol.

