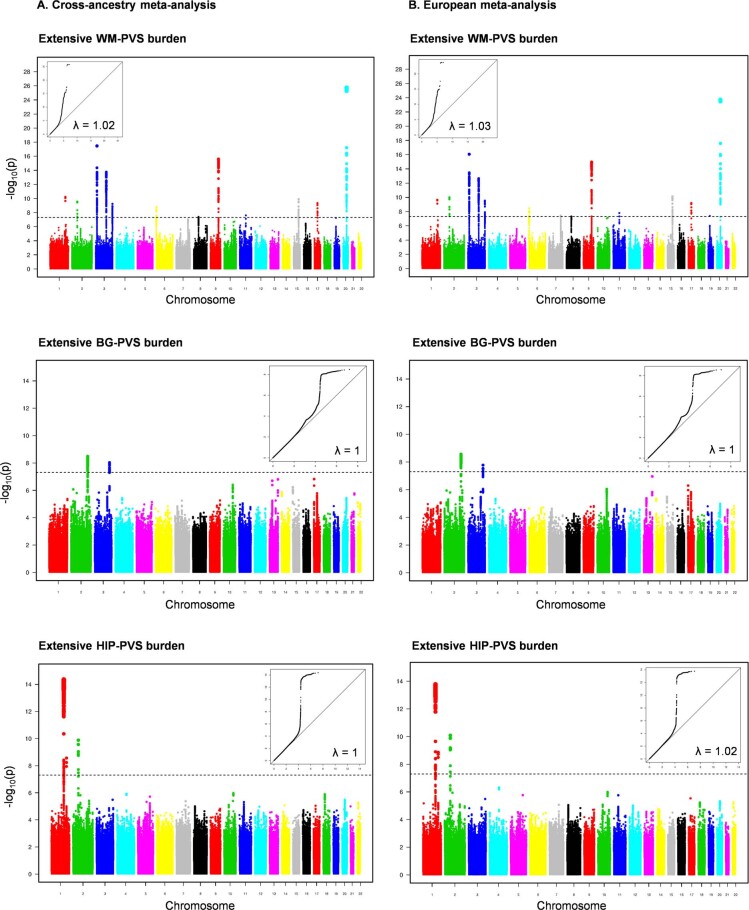
Extended Data Fig. 1. Manhattan and QQ plots of extensive PVS burden in the cross-ancestry and European meta-analyses.
Manhattan and Quantile-Quantile (QQ) plots of the p-values (observed versus expected) in the cross-ancestry (A) and European (B) GWAS meta-analyses are presented along with the genomic inflation factor (λ). For QQ plots the observed -log10(p) is represented in the y-axis and the expected -log10(p) in x-axis. The dotted line corresponds to the genome-wide significance threshold (p = 5×10⁻⁸, two sided). PVS indicates perivascular spaces; WM, white matter; BG, basal ganglia; HIP, hippocampus.

