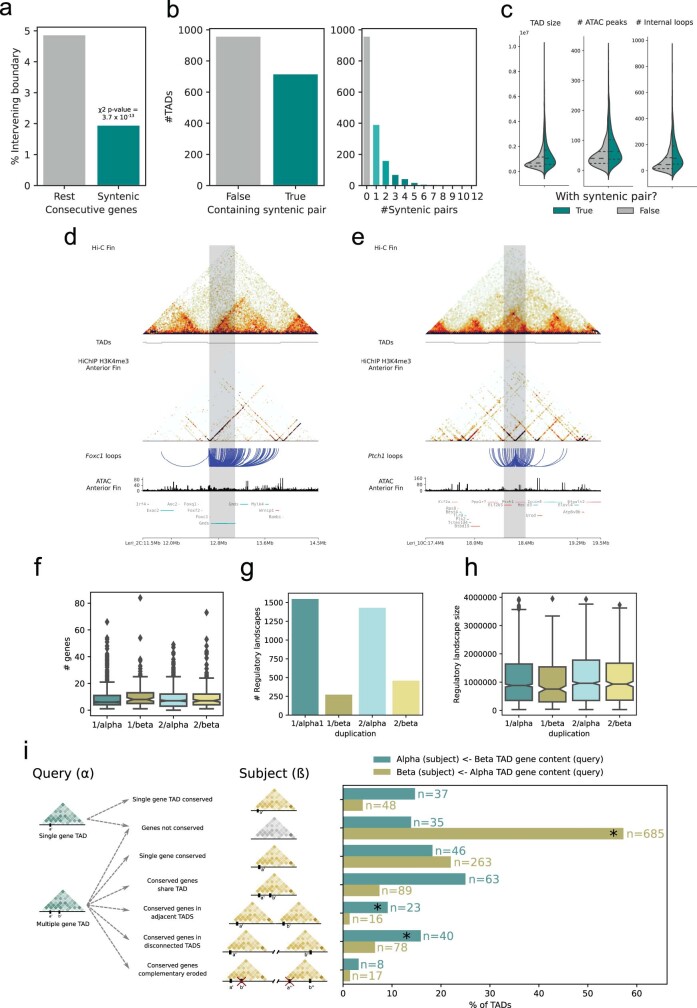
Extended Data Fig. 7. Conservation of vertebrate TADs after the Whole Genome Duplications.
a. Intergenic spaces between microsyntenic pairs conserved across vertebrates (present in skate and osteichthyes, here mouse and garfish) are devoid of TAD boundaries. Syntenic gene pairs n = 3017, non-syntenic n = 25386. Two-sided χ2 p-value = 3.7 x 10⁻¹³ b. 40% of skate TADs contain a deeply conserved microsyntenic pair. Several of them contain more than one association. c. TADs containing deeply microsyntenic associations are bigger, contain more ATAC-seq peaks and more loops as defined using HiChIP (Syntenic TAD n = 718, non-syntenic TAD n = 960). Foxc1/Gmds (d) and Ptch1/Eif2b3 (e) are examples of deeply conserved microsyntenic associations. Microsyntenic area is shaded in grey. Hi-C, TADs, HiChIP and ATAC-seq data are shown along with the gene tracks. f. Gene content of TADs associated to the different paralogous segments of the genome originated after the two rounds of WGD (1 or 2 for the 1R, alpha or beta for the 2R) Boxes correspond to the median and the first and third quartiles (Q1 and Q3). Whiskers extend to the last point within 1.5 times the interquartile range below and above Q1 and Q3, respectively. g. Number of regulatory landscapes (defined as the group of interactions anchored by a single gene promoter) belonging to the different paralogous segments of the genome originated after the two rounds of WGD (1 or 2 for the 1R, alpha or beta for the 2R). h. Regulatory landscape sizes observed in the paralogous segments of f defined as the genomic space spanning from the two more distal loop anchors anchored to a given promoter. Boxplots defined as in f. i. The fate of the counterparts of alpha TADs was investigated in the beta copy and vice versa. TADs with more than one gene conserved allowed us to infer scenarios of TAD fissions-fusions in either or the genome copies. Asterisks (*) highlight complete TAD losses in beta (yellow bar) and TAD fission events in alpha (blue bars).

