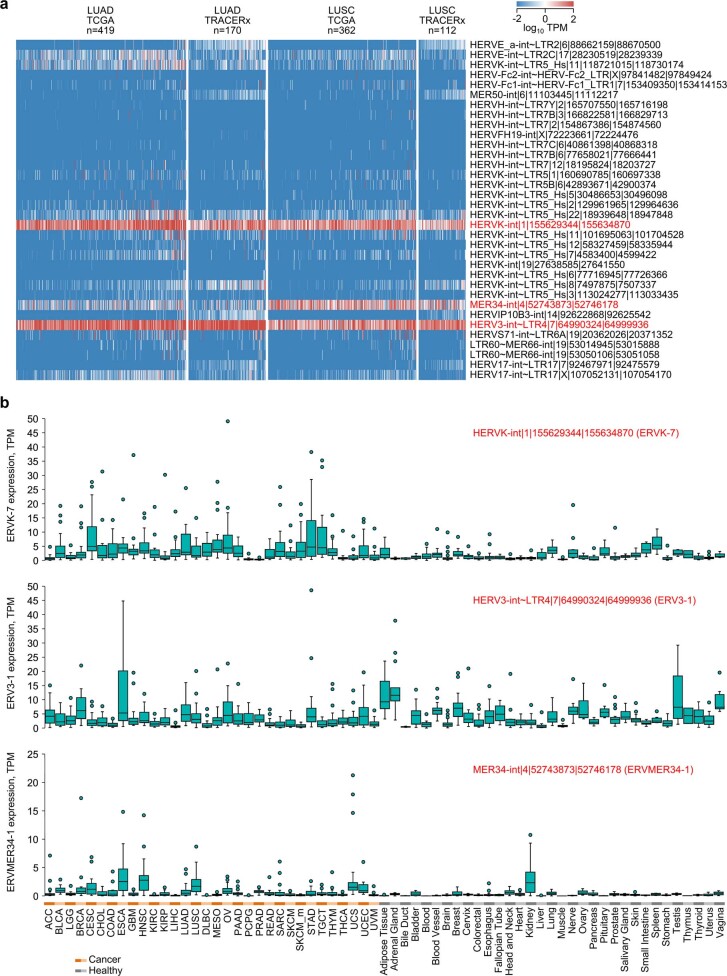
Extended Data Fig. 10. Envelope codogenic HERV expression in healthy and malignant tissues.
a, Heatmap of expression of envelope codogenic HERVs in TCGA and TRACERx LUAD and LUSC samples. For TRACERx patients, columns represent average expression of all individual tumour regions. b, Expression in TPM of ERVK-7, ERV3-1, and ERVMER34-1 in TCGA (n = 24 per cancer type) and GTEx (n = 2–156 per tissue type). Box plots denote median value and quartiles, whiskers denote 1.5x the interquartile range, and individual points denote outliers.

