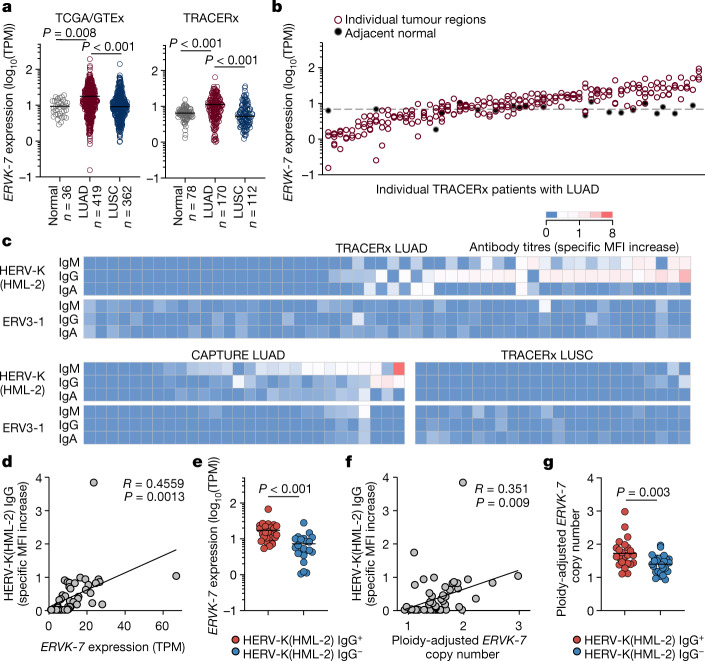
Fig. 4. Anti-HERV antibodies in patients with LUAD and LUSC.
a, Expression of ERVK-7 in transcripts per million (TPM) in TCGA LUAD (n = 419) and LUSC (n = 362) samples and GTEx healthy lung samples (n = 36) (left) and in TRACERx LUAD (n = 170), LUSC (n = 112) and adjacent normal tissue (n = 78) samples (right). For TRACERx patients, tumour values represent the average expression of all individual tumour regions. b, Expression of ERVK-7 in multiregion samples from TRACERx patients with LUAD (n = 63 patients with data available for at least three regions). Filled symbols and the dashed line represent individual paired normal lung tissue samples and average expression in all normal lung tissue samples, respectively. c, Quantification by flow cytometry of HERV-K(HML-2) and ERV3-1 envelope-binding antibodies in plasma or serum from TRACERx patients with LUAD (n = 52) and LUSC (n = 24) and in CAPTURE patients with LUAD (n = 28). Specific MFI increase values over control cells are denoted by the scale. d,e, Correlation of HERV-K(HML-2) envelope-reactive IgG titres and ERVK-7 mRNA expression (n = 47) (d) and ERVK-7 mRNA expression in TRACERx patients with LUAD with (HERV-K(HML-2) IgG+, n = 25) and without (HERV-K(HML-2) IgG−, n = 22) HERV-K(HML-2) envelope-reactive antibodies (e). f,g, Correlation of HERV-K(HML-2) envelope-reactive IgG titres and ploidy-adjusted ERVK-7 copy number (n = 53) (f) and ploidy-adjusted ERVK-7 copy number in TRACERx patients with LUAD with (HERV-K(HML-2) IgG+, n = 23) and without (HERV-K(HML-2) IgG−, n = 30) HERV-K(HML-2) envelope-reactive antibodies (g). The y axis represents the maximum copy number in individual tumour regions for each patient. Symbols in a and b represent individual patients and individual regions, respectively, and P values were calculated by one-way ANOVA on ranks with Dunn’s correction for multiple comparisons in a and two-sided Mann–Whitney rank-sum test in e,g; R and P values were calculated using linear regression in d,f.

