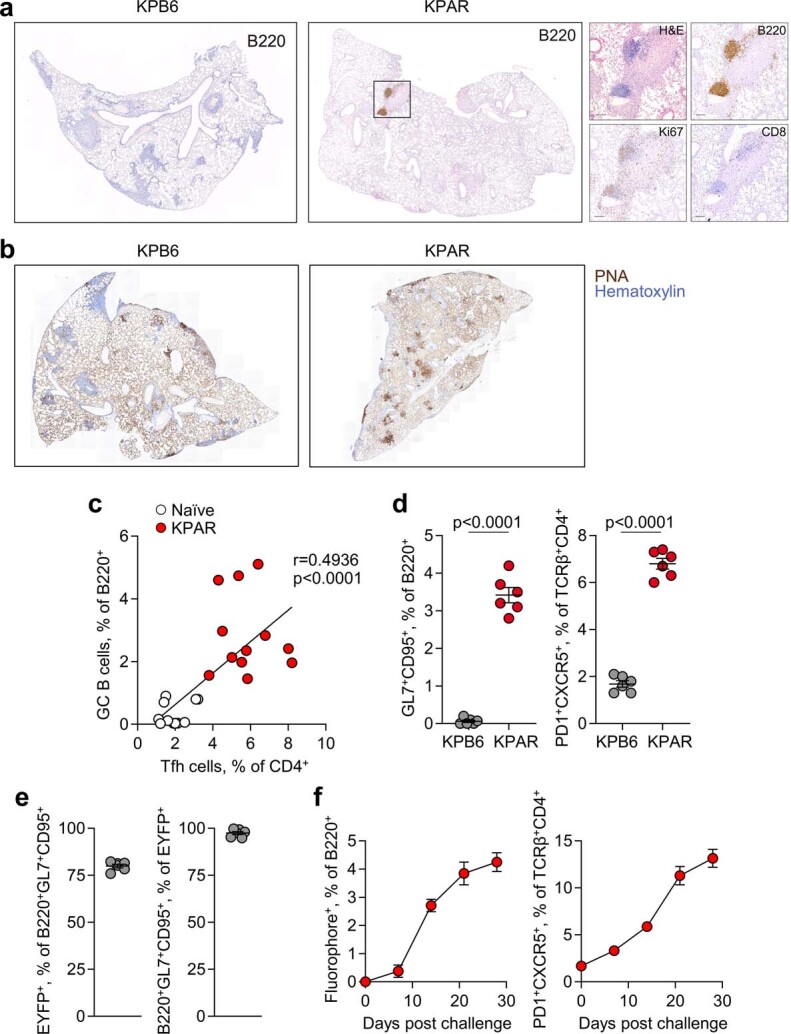
Extended Data Fig. 1. TLS formation in murine LUAD models.

a, Immunohistochemistry for B220, Ki67, and CD8 in KPB6 and KPAR lungs, with inset KPAR TLS shown at higher magnification. Representative images of 10 individual mice from the same experiment. b, Staining with peanut agglutinin (PNA) in KPB6 and KPAR lungs. Representative images of 10 and 4 individual mice from the same experiment for KPB6 and KPAR tumours, respectively. c, Correlation between GC B and TFH cells in naïve and KPAR lungs, from Fig. 1d (n = 12 per group from 3 experiments). R and p values were calculated using linear regression. d, Quantification by flow cytometry of B220+GL7+CD95+ GC B cells and TCRβ+CD4+PD1+CXCR5+ TFH cells in KPB6 and KPAR lungs (n = 6 per group from 2 experiments). Data are represented as mean ± s.e.m. and p values were calculated using two-sided Student’s t-tests. e, Labelling efficiency of GC B cells in AicdaCreERT2;Rosa26LSL-EYFP mice (n = 6). Tamoxifen was administered 1 and 3 days prior to analysis. f, Time course quantification by flow cytometry of B220+fluorophore+ (IghgCre fate-mapped) or TCRβ+CD4+PD1+CXCR5+ TFH cells in KPAR lungs in IghgCre;Rosa26LSL-Confetti mice (n = 4 per time point).
