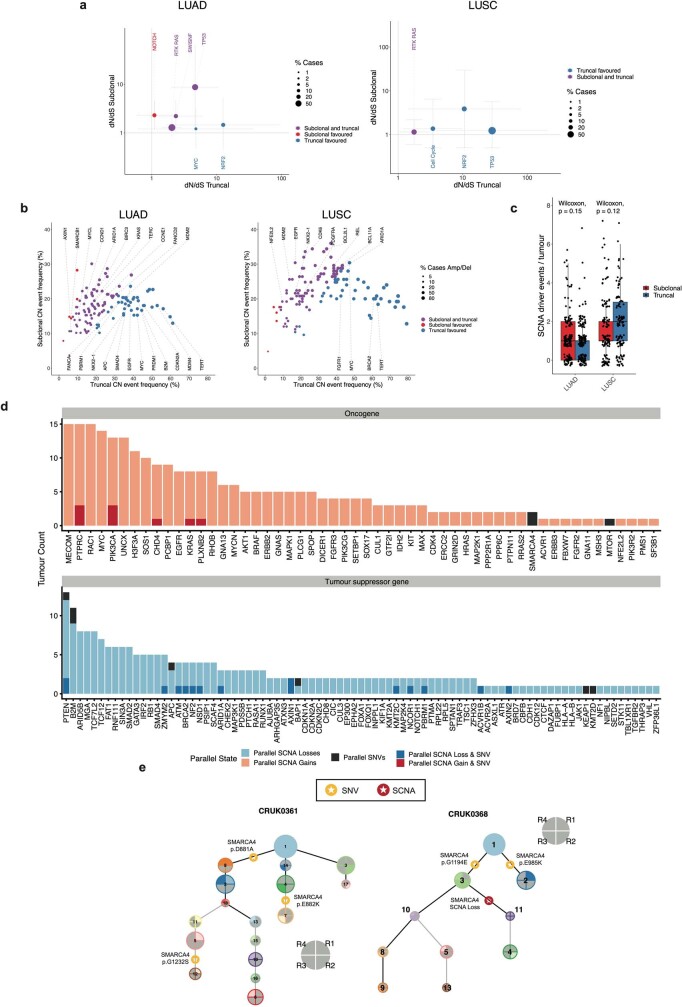
Extended Data Fig. 8. Extended analysis of selection, parallel subclonal events within tumour phylogenies and frequency of SCNA drivers.
a. Pathway level dN/dS analysis in LUAD and lung LUSC from 358 tumours (Methods). b. Frequency of amplification and deletion events in significantly amplified or deleted loci identified by GISTIC2.0 in 358 tumours (Methods). c. Overall frequency of amplifications and deletions in significantly amplified or deleted loci identified by GISTIC2.0 and containing known drivers in LUAD and LUSC per tumour across 358 tumours shown using box and whisker plots (Methods). Wilcoxon-test P values are shown. d. Barplots indicate for each oncogene (top) and tumour suppressor gene (bottom) the number of tumours where a parallel evolution event was observed. Pale red and blue bars indicate where a somatic copy number alteration (SCNA) (gain or loss) was observed multiple times in the same gene and in parallel in the same tumour. Dark red and blue bars indicate where an SCNA (gain/loss) was observed in parallel with a single nucleotide variant (SNV) in the same gene and in the same tumour. Black bars indicate where SNVs in the same gene were observed multiple times in the same tumour and in parallel. e. Examples of parallel events in SMARCA4. In CRUK0361 and CRUK0368 we noted multiple independent mutations in SMARCA4. These are indicated with yellow stars. In each case, the mutations can be mapped to branches of the tumour’s phylogenetic tree that do not overlap, indicating that these mutations had arisen in parallel. In the case of CRUK0368, a copy number loss was also observed. This is indicated by a red star. A more complete description of tree schematics is available in the Methods section. R = Region; CN = Copy number.

