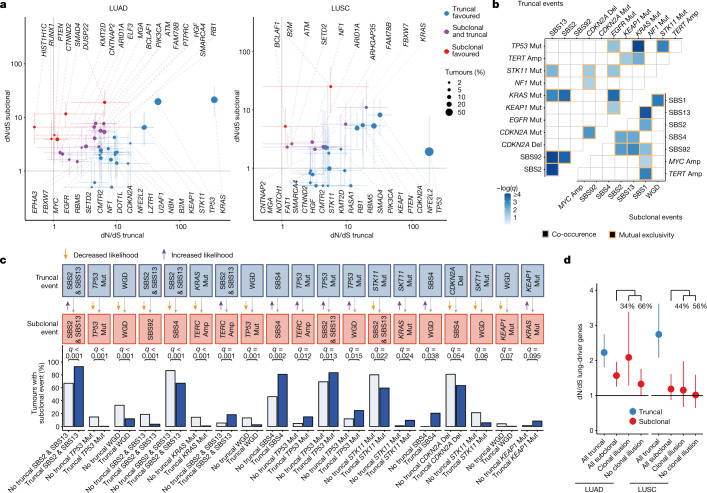
Fig. 3. Timing of selection and evolutionary dependencies.
a, Gene-level selection in point mutations measured using dN/dS ratios comparing truncal and subclonal mutations in LUAD and LUSC with 95% CIs for dN/dS ratios for 358 tumours. Error bars indicate 95% CIs. dN/dS values below 0.5 and associated with 95% CIs overlapping 1 are limited to 0.5. b, Mutual exclusivity and co-occurrence relationships among driver gene mutations, SCNAs and signatures between 401 tumours in the TRACERx cohort of 421 patients for both truncal and subclonal contexts using DISCOVER. c, Ordering interactions found in the TRACERx 421 cohort in which the presence of a truncal event modifies the probability of a given subclonal event downstream using 401 tumours. d, Comparisons of the overall amount of selection in point mutations of lung-cancer-driver genes in LUAD and LUSC using dN/dS, considering all truncal mutations, all subclonal mutations and subsets of subclonal mutations with and without an illusion of clonality using 358 tumours. The percentage of subclonal mutations with and without clonal illusion in LUAD and LUSC is displayed. Amp, amplification; Del, deletion; Mut, mutation.

