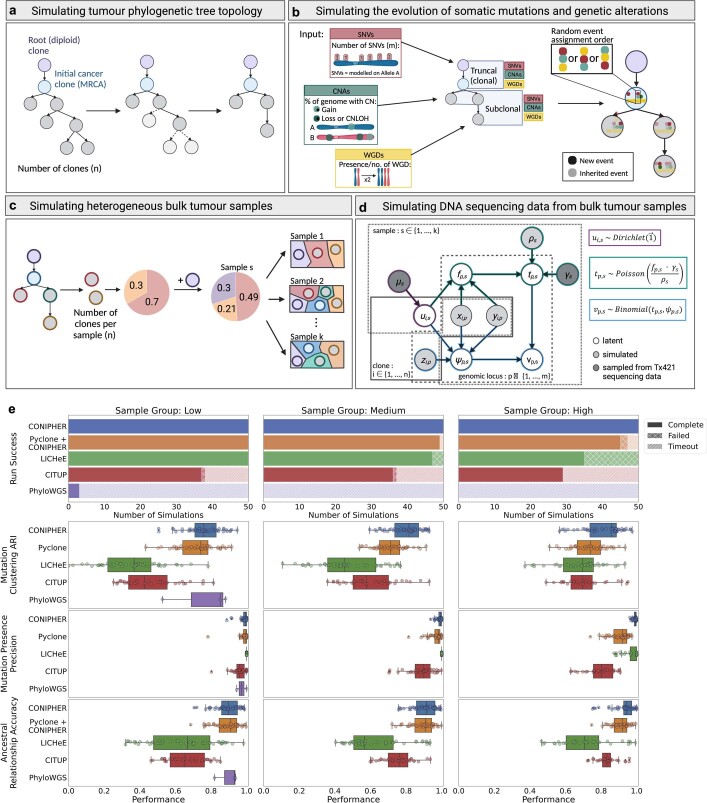
Extended Data Fig. 4. Benchmarking the new phylogenetic reconstruction method and comparison with existing approaches.
a. Simulation of tree topology. b. Simulation of genetic events occurring on each edge of the phylogenetic tree. c. Simulating multiple heterogeneous tumour samples from the genetic events in the tree phylogeny. d. Simulating the resulting DNA sequencing data from the heterogeneous tumour samples. e. Every row represents a different evaluation metric measuring the performance of the new computational method for tumour phylogenetic reconstruction (blue) and four existing approaches (Pyclone in orange, LICHeE in green, CITUP in red, and PhyloWGS in purple) when applied to 150 simulated datasets separated into three groups according to the number of tumour samples: 2-3 samples in the low category (left), 4-7 samples in the medium category (middle), and >7 samples in the high category (right). The first row demonstrates the number of datasets for which each method was able to successfully reconstruct a tumour phylogenetic tree (solid colour indicates successful completion, hatched colour indicates that a method was unable to reconstruct a phylogenetic tree and striped colour represents that the method failed to complete within a time limit of 8 h). The second row represents the Adjusted Rand index (ARI) of mutation clustering which measures the identification of mutations belonging to the same tumour clone. The third row represents the mutation presence precision which evaluates the proportion of mutations identified as present in a sample that are truly present. The last row represents the ancestral relationship accuracy which measures the proportion of mutation pairs for which the correct phylogenetic relationship has been retrieved. Every dot refers to a different simulated dataset. Box plots show the median and the interquartile range (IQR), and the whiskers denote the lowest and highest values within 1.5 times the IQR from the first and third quartiles, respectively.

