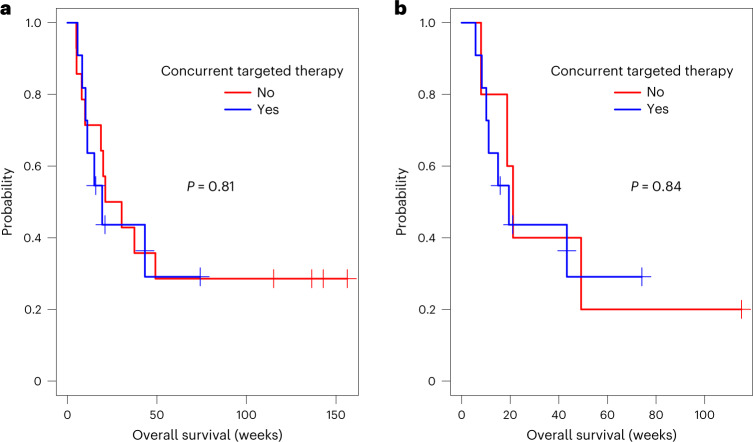
Fig. 3. OS for all patients and BRAF mutant patients, stratified by the use of concurrent targeted therapy.
a,b, Kaplan–Meier curves of OS for (a) all treated patients (n = 25) stratified by the use of concurrent targeted therapy (yes:no = 11:14), regardless of BRAF mutation status and (b) BRAF mutant patients (n = 16), stratified by the use of concurrent targeted therapy (yes:no = 11:5). Censored subjects are indicated by tick marks. P values were derived from the two-sided log-rank test. No adjustment was made for multiple comparisons.

