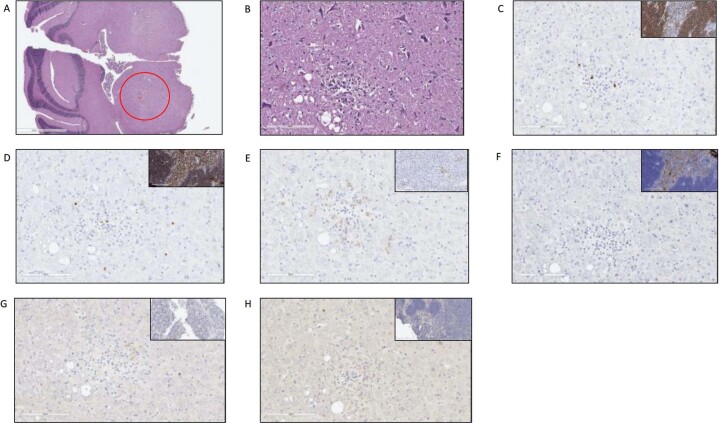
Extended Data Fig. 3. Assessment of inflammatory response after IT administration of either PBS, Isotype or anti-PD1.
Sample mouse brain parenchyma pathology 7 days following intrathecal injection of anti-PD1 antibody (6.5 µl). A and B: H & E, 2x (A) and 20x (B). C-H staining for CD8 (C), CD3 (D), PD1 (E), PD-L1 (F), CD15 (G) and CD163 (H). Upper right insert represents positive control. Of note, no evidence of treatment related inflammation was noted at the 48 hours, 7 days and 14 days timepoint (representative data shown).

