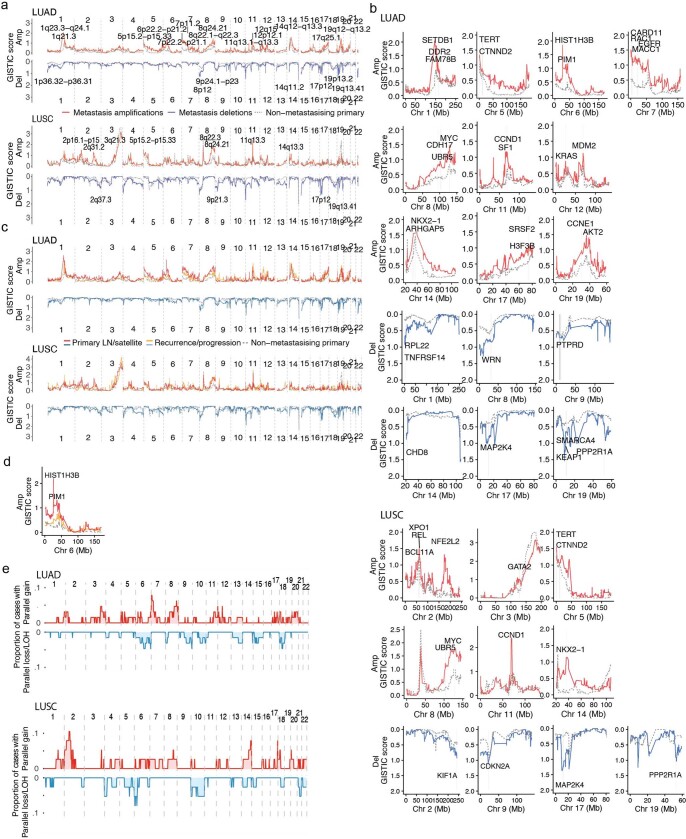
Extended Data Fig. 7. Somatic copy number aberration selection in metastases.
a. Across-genome GISTIC2.0 scores are plotted for amplifications and deletions for lung adenocarcinoma (LUAD) and lung squamous cell carcinoma (LUSC). Annotated cytobands contain genes overlapping loci with significant G-scores in the metastasis cohort and that have a GISTIC2.0 score difference (GSD) >0 between unpaired metastases and non-metastasizing tumours. b. Individual chromosome plots highlighting genes overlapping significant loci in the metastasis cohort with GSD > 0 that were detected in the unpaired analysis performed in a. c. Across-genome GISTIC2.0 scores are plotted for amplifications and deletions for LUAD and LUSC separating primary LN/satellite lesions and recurrence/progression samples. d. Individual plot highlighting GSD between primary LN/satellite lesions, recurrence/progression samples and non-metastatic primary regions on chromosome 6 encompassing HIST1H3B. The locus is significantly amplified in the primary LN/satellite lesions (GSD = 1.90, q = 1.30e-7). e. Across genome plot showing the frequency of parallel gains/amplification events in red, and frequency of parallel loss/LOH events in blue. The top and bottom panels show the parallel evolution between primary regions harbouring the seeding clone and their paired metastases in LUAD and LUSC respectively; Amp, amplification; Del, deletion; Chr, chromosome; Mb, megabase.

