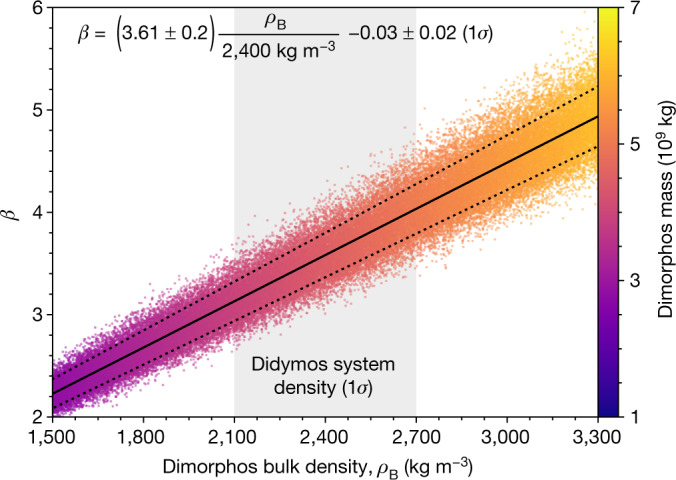
Fig. 3. β as a function of Dimorphos’s bulk density ρB, from the dynamical Monte Carlo analysis.

Individual samples are plotted as points, whereas the linear fit for the mean β is plotted as the solid line and the dotted lines show the 1σ confidence interval. The colour bar indicates the mass of Dimorphos corresponding to each Monte Carlo sample, which is determined by bulk density and the volume. The density range shown corresponds to the 3σ range of the Didymos system density, whereas the shaded region highlights the 1σ range1. If the density of Dimorphos were 2,400 kg m−3, the densities of Didymos and Dimorphos would be the same as the system density, and β = (1σ). For context, the densities of three other S-type near-Earth asteroids are in the range shown: 433 Eros32 at 2,670 ± 30 kg m−3; 25143 Itokawa33 at 1,900 ± 130 kg m−3 and 66391 Moshup34 at 1,970 ± 240 kg m−3.
