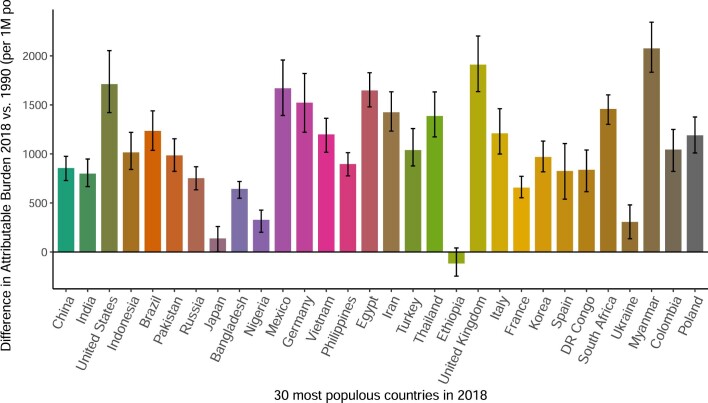
Extended Data Fig. 7. Difference in the absolute burden of T2D attributable to suboptimal diet between 1990–2018 in the top 30 most populous countries in 2018.
Bars represent the estimated absolute change in the absolute burden per 1 M population of T2D incidence due to suboptimal intake of 11 dietary factors jointly: insufficient intake of whole grains, yogurt, fruit, nuts and seeds, and non-starchy vegetables; and excess intake of refined rice and wheat, processed meats, unprocessed red meat, sugar-sweetened beverages, potatoes, and fruit juice. The burden due to suboptimal diet was estimated using proportional multiplication, assuming that half the benefit of whole grains intake is mediated through replacement of refined rice and wheat intake. Countries are ordered based on population size in 2018, from highest to lowest. See Supplementary Table 1 for more details on the inputs for each dietary factor. Data are presented as the central estimate (median) and corresponding 95% uncertainty interval, derived from the 2.5th and 97.5th percentiles of 1000 multiway probabilistic Monte Carlo model simulations.

