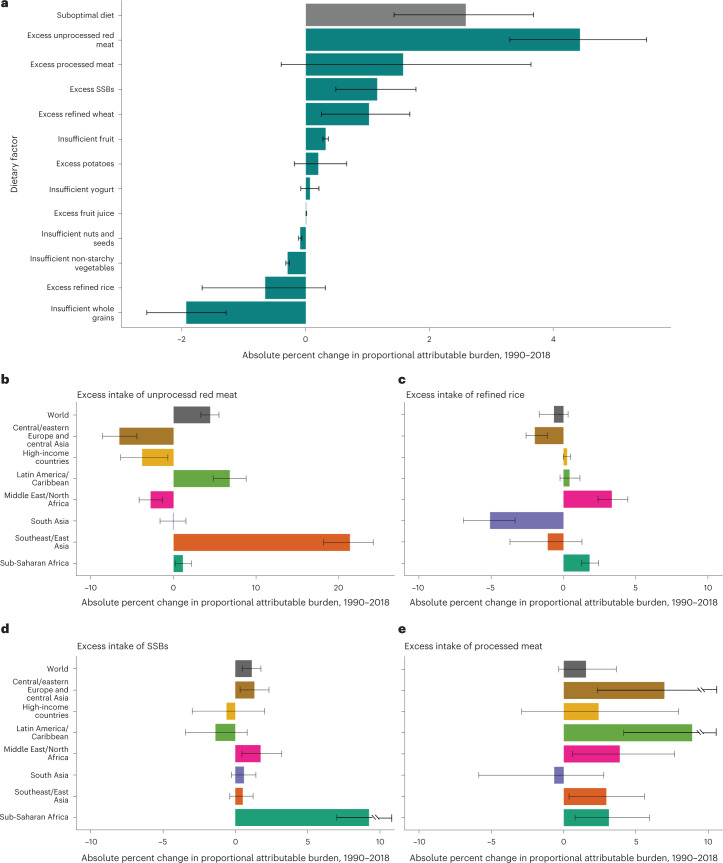
Fig. 5. The absolute change in the proportional burden of T2D attributable to suboptimal diet and each individual risk factor between 1990 and 2018 globally and by world region for four select dietary factors.
Bars represent the estimated absolute change in proportional burden of T2D incidence (a) globally due to suboptimal intake of 12 dietary factors jointly and individually: insufficient intake of whole grains, yogurt, fruit, nuts and seeds, and non-starchy vegetables and excess intake of refined rice, refined wheat, processed meats, unprocessed red meat, SSBs, potatoes and fruit juice. The burden due to suboptimal diet was estimated using proportional multiplication, assuming that half the benefit of whole-grain intake is mediated through replacement of refined rice and wheat intake. In addition, excess intake of four dietary factors (unprocessed red meat (b), refined rice (c), SSBs (d) and processed meat (e)) is included as illustrative examples of the estimated absolute change in percentage burden of T2D, with the remaining dietary factors included in Extended Data Figs. 5 and 6. A different x-axis range was used for b to account for the magnitude of absolute change in T2D burden attributable to excess intake of unprocessed red meat in southeast and East Asia. A negative absolute change in proportional burden indicates a reduction in the diet-attributable burden of T2D between 1990 and 2018 (for example, reduced intake of harmful dietary factors, increased intake of protective dietary factors), while a positive absolute change in percentage burden indicates an increase in the diet-attributable burden of T2D during that time frame (for example, increased intake of harmful dietary factors, decreased intake of harmful dietary factors). Countries were delineated into world regions by the GDD. Data are presented as the central estimate (median) and the corresponding 95% UI, derived from the 2.5th and 97.5th percentiles of 1,000 multiway probabilistic Monte Carlo model simulations.

