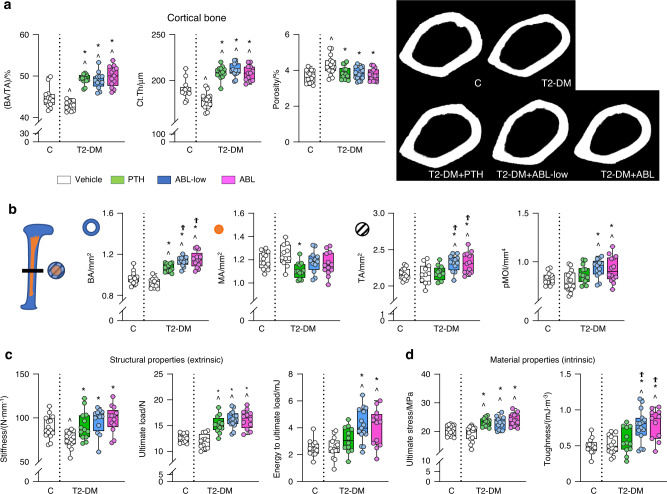
Fig. 2.
PTH and ABL corrected the cortical architectural deterioration induced by diabetes and increased bone strength. Micro-CT analysis of femur cortical bone microarchitecture and 3-point bending analysis of bone strength after treatment with PTH or ABL. a Cortical bone area/tissue area (BA/TA), thickness (Ct.Th) and porosity and representative images. b Bone area (BA), medullary area (MA), total area (TA) and polar moment of inertia (pMOI). c Bone structural properties (stiffness, ultimate load, and energy to ultimate load) and d bone material properties (ultimate stress and toughness). n = 12–15 mice per group. Data are presented as box & whisker plot where each dot represents a mouse. ^P < 0.05 versus C mice by one-way ANOVA with post hoc Dunnet’s correction; *P < 0.05 versus T2-DM mice treated with vehicle and ϮP < 0.05 versus T2-DM mice treated with PTH by one-way ANOVA with post hoc Tukey’s correction

