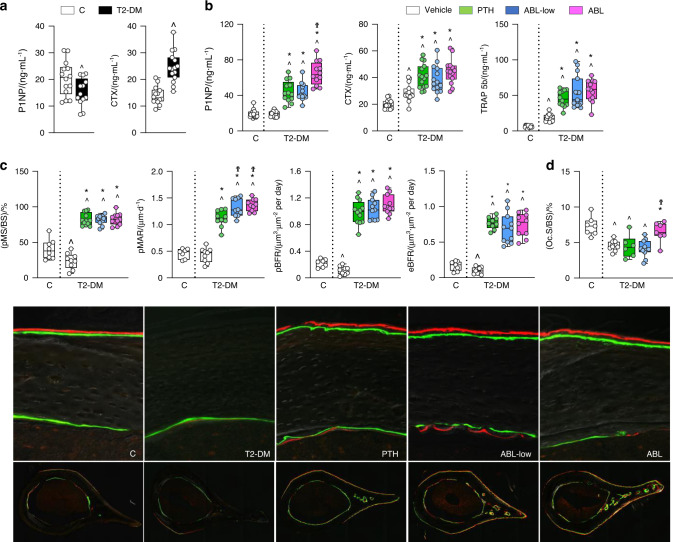
Fig. 3.
PTH and ABL reversed the impaired osteoblast function in diabetes, but ABL was more potent. Serum P1NP and CTX measure a before (t3) and b P1NP, CTX, TRAP5b measure after (t4) treatment with PTH or ABL. c Dynamic bone histomorphometric analysis of periosteal mineralized surface/bone surface (MS/BS) and mineral apposition rate (MAR) and periosteal and endosteal bone formation rate (BFR) of the cross-section of the femoral mid-diaphysis and representative images. d Surface covered by osteoclasts (OcS/BS). n = 12–15 mice per group. Data are presented as box & whisker plot where each dot represents a mouse. ^P < 0.05 versus C mice by unpaired and two-tailed Student’s t-test (a) or one-way ANOVA with post hoc Dunnet’s correction (b–d); *P < 0.05 versus T2-DM mice treated with vehicle and ϮP < 0.05 versus T2-DM mice treated with PTH by one-way ANOVA with post hoc Tukey’s correction

