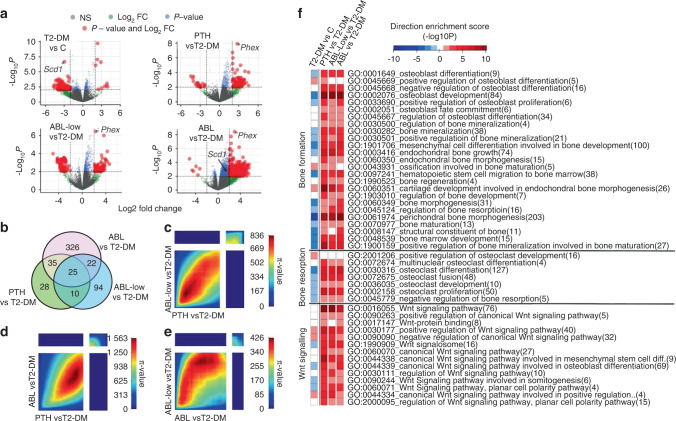
Fig. 4.
PTH and ABL generated shared and unique molecular signatures in bone and corrected the dysregulated bone remodeling and Wnt signaling transcriptome induced by T2-DM. a Volcano plots illustrate numbers of significantly downregulated or upregulated DEGs for each comparison. b Venn diagram depicts the number of unique and shared DEGs in L4 bones. c–e The π-value heatmaps resulting from Rank-Rank Hypergeometric Overlap (RRHO) analysis show high concordance in the gene expression signatures of PTH and ABL in the context of T2-DM. f A directional gene set enrichment analysis of the gene ontology (GO) terms in the DEGs was performed using the PIANO package. The heat map shows the value of the enrichment score (-log10(enrichment P-value)). The GO terms are color-coded to illustrate the direction of the gene expression changes in the majority of genes included in the respective GO term, i.e., red for upregulation and blue for downregulation

