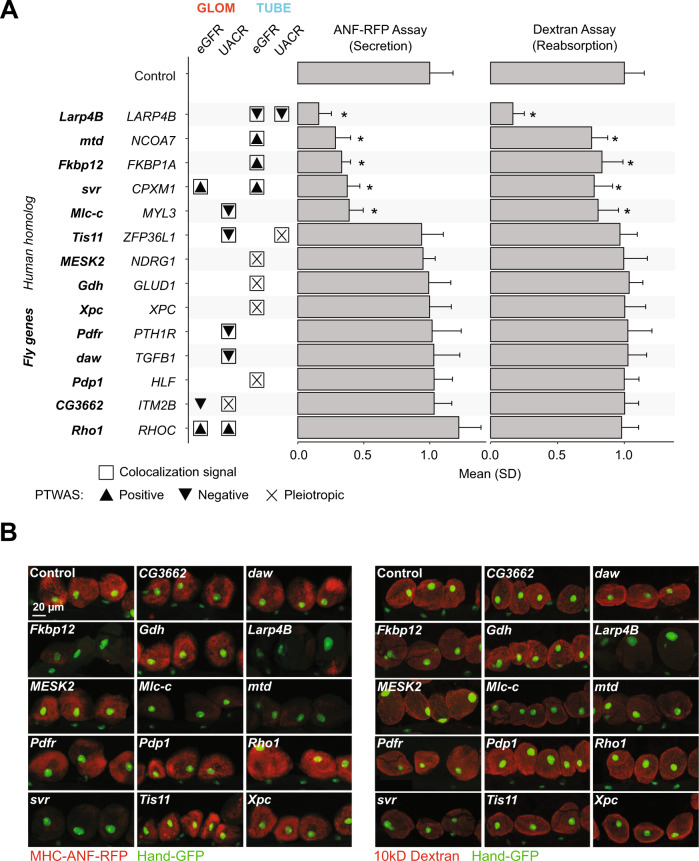
Fig. 6. The impact on Drosophila nephrocyte function caused by RNAi of the kidney trait-associated genes.
A Comparison of 14 genes and RNAi control. n = 60 nephrocytes from 3 biologically independent Drosophila (20 nephrocytes per Drosophila). Drosophila genes are followed by human homologs and association indicator from tissue-phenotype analyses: colocalization (RCP ≥ 0.5) and PTWAS associations (FDR ≤ 0.05), including direction of effect. Bar plots indicate mean and standard deviation (SD) of fluorescence of nephrocytes. Significant differences (two-sided t-test) between the gene and control are indicated (*P ≤ 0.001). Exact P values are in Supplementary Data 10. B Fluorescence microscopy images for representative nephrocytes for each Drosophila gene. Left panel: MHC-ANF-RFP assay. Right panel: 10kD Dextran; Hand-GFP nephrocyte nucleus. The scale bar is 20 µm, and it is the same scale for all the panels in this figure.

