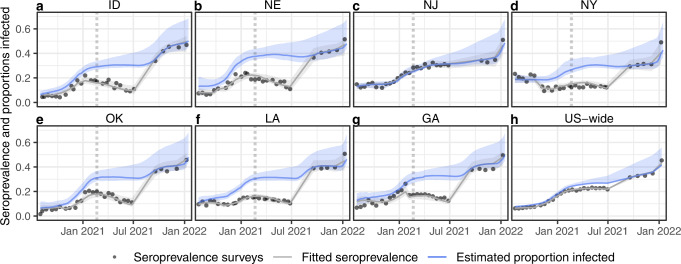
Fig. 3. Time series of survey seroprevalence and estimated proportions infected for seven example states and U.S.-wide.
Example time series of survey seroprevalence, fitted seroprevalence and estimated proportion infected for (a) Idaho, (b) Nebraska, (c) New Jersey, (d) New York, (e) Oklahoma, (f) Louisiana, (g) Georgia, and (h) the United States. For all of these states, seroprevalence was estimated primarily using the Abbott assay prior to September 2021 (see Supplementary Figs. 1 and 3), except for (c) New Jersey, for which the Roche assay was exclusively used. The proportion infected was estimated using the best waning logistic regression by LOO median RMSE (Fig. 2 and Table 1). U.S.-wide estimates were obtained by taking mean values per round weighted by state populations, and each round was plotted taking the mean week for that round across all states. Uncertainty envelopes around fits and estimated proportions infected include model uncertainty and uncertainty around the selection of times to seroreversion and lead or lag between seroprevalence and reported cases (see Methods). The U.S.-wide ribbon does not include model uncertainty. Vertical dotted lines indicate the start of the vaccination campaigns. See Supplementary Fig. 9 for time series for all states included in the model.

