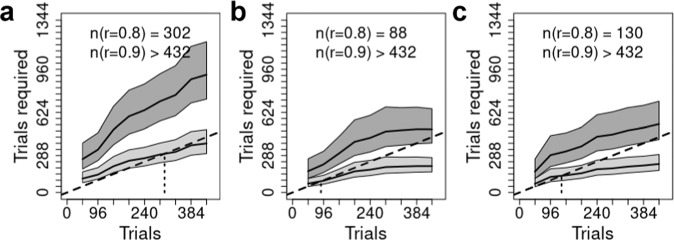
Fig. 5. Trials required for reliable results.
The total number of trials to achieve reliabilities (r) of 0.8 (lower line, light gray band) and 0.9 (upper line, dark gray band). Gray bands represent the posterior median 95% credible intervals. For every point on the x-axis we are predicting the number of trials required to achieve a reliability of 0.8 (light gray region) or 0.9 (dark gray region); the dotted vertical line descending from the dashed identity line (i.e., a line where x = y), and the values in text, provide the interpolated number of trials required for reliabilities of 0.8 and 0.9. Each panel represents a single task from Hedge et al.: (a) Simon, (b) Stroop, (c) Flanker.

