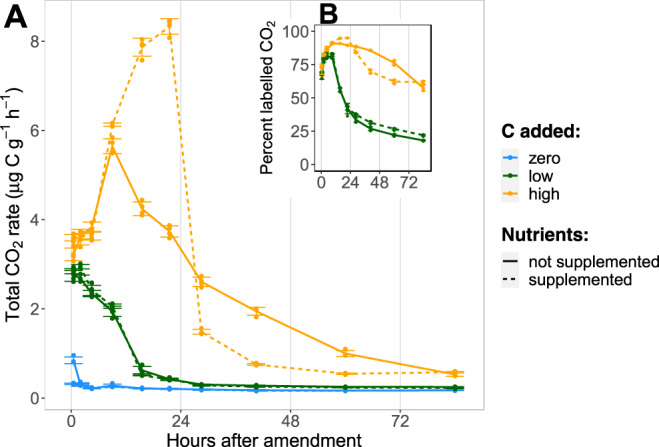
Fig. 1. Time-series of the CO2 efflux from soil microcosms.

A Total CO2 efflux following addition of a readily degradable 13C-labelled carbon source (glucose at 0, 90, and 400 µg C g−1 soil) with or without mineral nutrient supply (N, P, K, S). Each point reflects the average rate of CO2 efflux at the mid-point of the sampling interval. B Percent of total CO2 derived from the added glucose. Error bars show standard deviation (n = 4 independent soil microcosms).
