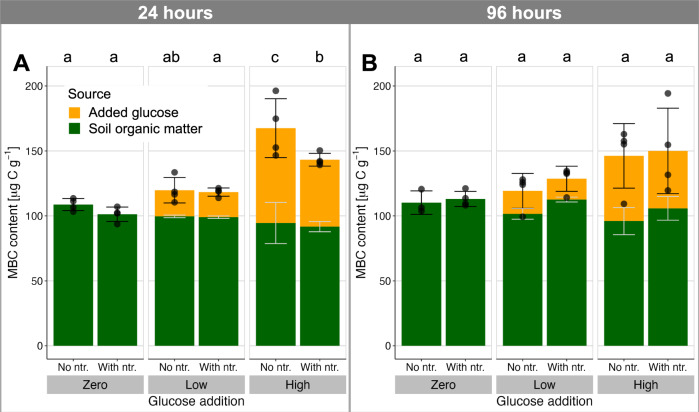
Fig. 3. Extractable soil microbial biomass determined by chloroform fumigation-extraction.
A 24 h and B 96 h after addition of a readily degradable, 13C-labelled carbon source (glucose at 0, 90, and 400 µg C g−1 soil) with or without mineral nutrient supply (ntr.; N, P, K, S). The heights of the bars represent the mean±standard deviation as black errorbars (n = 4 independent soil microcosms except for one treatment with n = 3: zero glucose, no nutrients at 96 h). Contrasting colours reflect the source of the extractable biomass as determined by isotopic composition, with light grey error bars showing mean±standard deviation of the relative composition. Lowercase letters above the plots show post-hoc differences in mean total storage with p < 0.05 (2-sided Tukey HSD test, which adjusts for multiple comparisons). Corresponding C:N ratios are presented in Supplementary Fig. S3.

