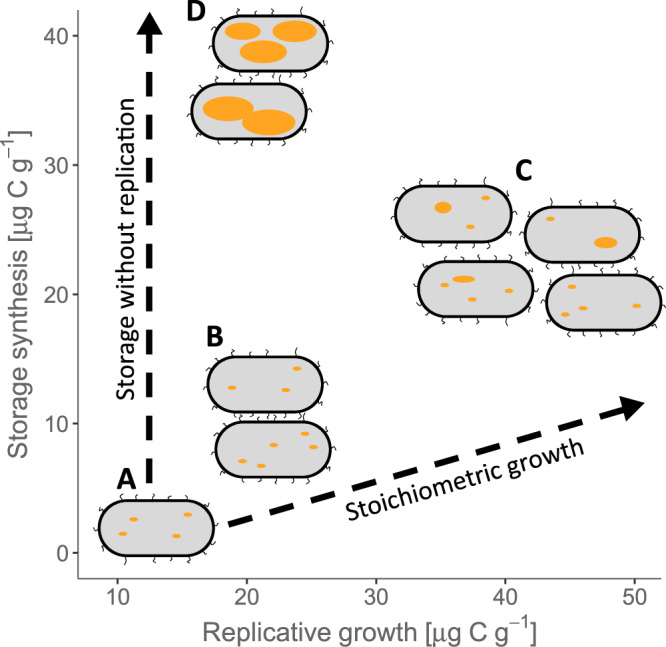
Fig. 5. Intracellular storage represents an alternative pathway for growth of microbial biomass.

In this conceptual figure the y-coordinates reflect the measured incorporation of added C into storage after 96 h, and the x-axis represents replicative growth measured by 18O incorporation into DNA (see also Fig. 4). According to contemporary assumptions, all growth should follow the stoichiometric growth curve that maintains constant element ratios in the biomass (dashed line to the right). The microbial population is shown schematically by bacterial cells, with yellow lipid inclusion bodies representing storage. Without C supply, only low levels of replicative growth occur A. Low C additions (with ample nutrients) stimulate replicative growth and limited C incorporation into storage B, with the ratio of new storage to non-storage biomass staying close to that predicted by assuming constant biomass stoichiometry. High C addition with complementary nutrients stimulates both strong replicative growth as well as disproportionately large storage synthesis C, moderately violating the stoichiometric assumption. However, nutrient limitation switches growth strongly towards storage D, incorporating C into biomass with little replicative growth, closer to the extreme case of pure storage without replication than the assumption of stoichiometric growth.
