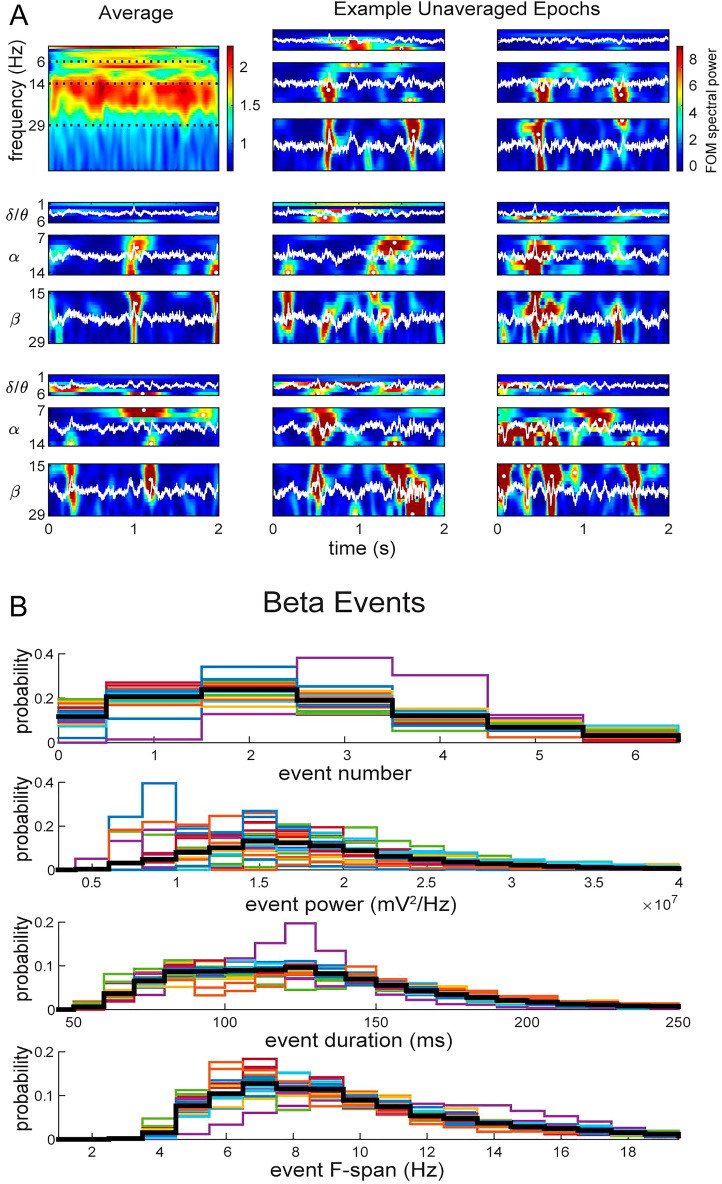
Figure 4.
Low-frequency rhythms emerge as quantifiable transient high-power events (white dots) from non-averaged time-series waveform (white line) converted into TFRs. (A) Spectrogram showing average Fpz electrode power (normalized by the median value of each frequency) over frequency and time across all pre-treatment epochs from an example patient (top left), and time–frequency spectrograms of eight randomly chosen individual epochs for each BOI. Color bar denotes heat map of power values as factors of the median (FOM) spectral power. (B) Histograms showing the distribution of all beta event feature measurements from the Fpz electrode for individual patients (colored lines) and the average (black line). Event number is counted over 2 s epochs. See Supplementary Info for further Spectral Event feature quantification across frequency bands (Fig. S.2) and across all electrodes (Table S.1).

