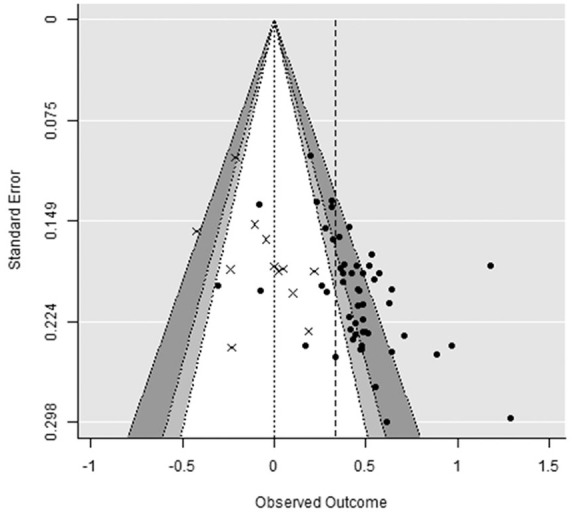
Figure 3.

Funnel plot for the interaction effects between mortality salience and norm salience (m = 64).
Note. Dependent effect sizes within three studies were averaged together for display purposes. Crosses represent unpublished data. The crude dashed line represents the average effect size. Shaded regions represent .10 > ptwo-tailed > .05 (light gray) and .05 > ptwo-tailed > .01 (dark gray).
