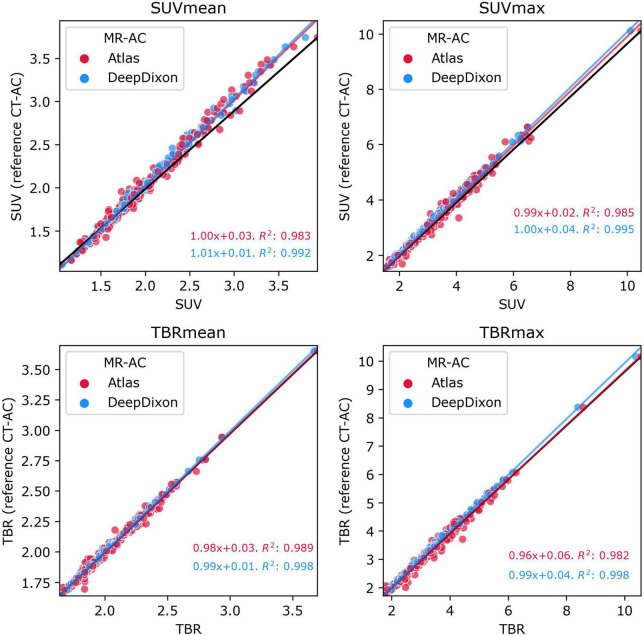
FIGURE 3.
Plot of mean (left panels) and max (right panels) values within the tumor ROI of [18F]FET-PET tissue activity concentration (top panels) and TBR (bottom panels) for atlas and DeepDixon vs. CT-AC reference standard (n = 222). The black line indicates the unity line. The goodness-of-determination (R2) was calculated including follow-up examinations.

