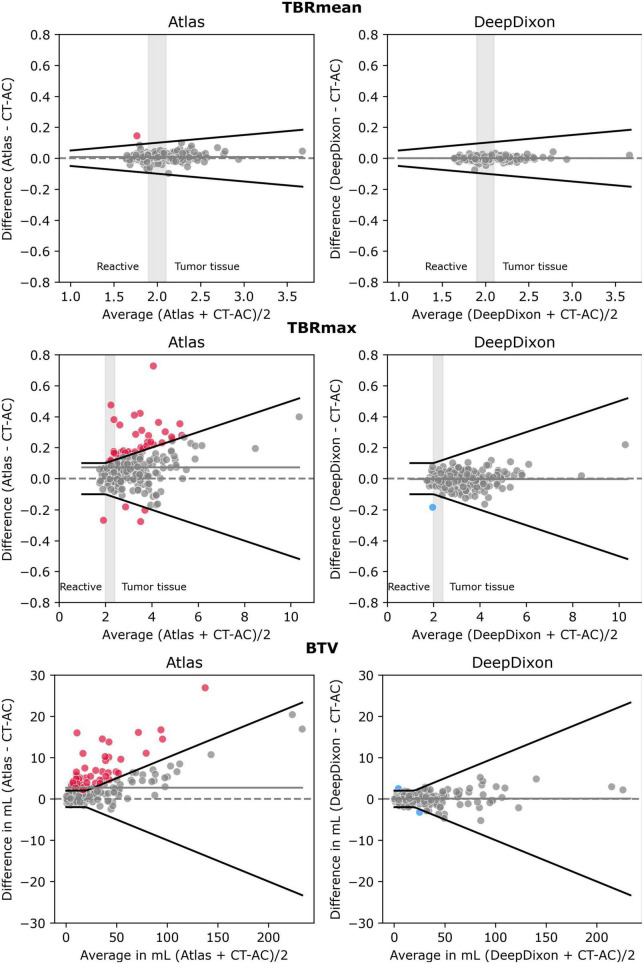
FIGURE 4.
Bland-Altman plot of TBRmean (top), TBRmax (middle) and biological tumor volume (BTV) (bottom) for each of the two MR-AC methods against the reference standard CT-AC (n = 222 scans). To simulate the clinical impact of the metrics in evaluating reactive changes vs. tumor recurrence 3 intervals have been labeled along the x-axis for TBRmean and TBRmax. The gray shaded areas define an interval of ambiguity. The black lines indicate the acceptance criteria of TBRmean of ± 0.05 or 5%, TBRmax of ± 0.1 or 5%, or BTV of ± 2 ml or 10%, respectively. Points that exceed the criteria have been colored. The solid gray line indicates the mean value.

