FIGURE 5.

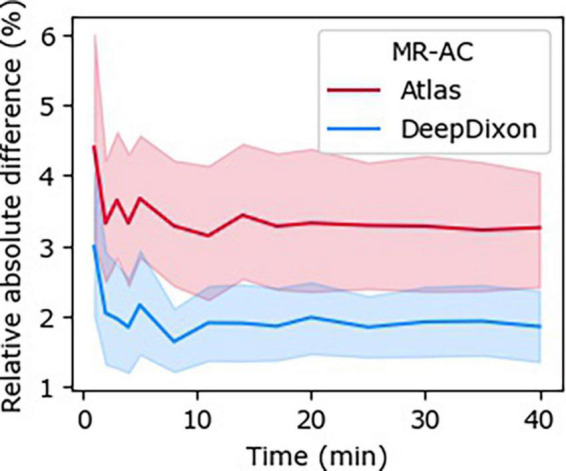
Relative absolute difference between time-activity curves (TACs) across all subjects (n = 23) to the dynamic 40-min positron emission tomography (PET) with CT-AC reference for each of DeepDixon and atlas MR-AC, respectively.

Relative absolute difference between time-activity curves (TACs) across all subjects (n = 23) to the dynamic 40-min positron emission tomography (PET) with CT-AC reference for each of DeepDixon and atlas MR-AC, respectively.