
FIGURE 7.
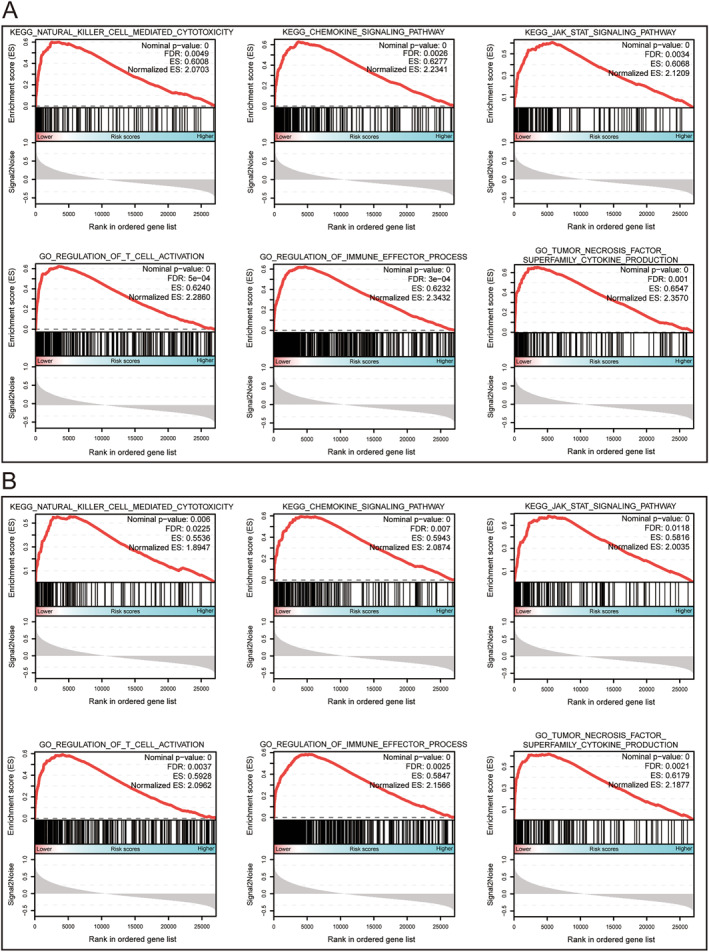
The results of GSEA for the OS (a) and RFS (b) prognostic model. The median expression of each LILR gene was used as the cut‐off point, which defined the higher and lower risk groups for the early‐stage PDAC.
Official websites use .gov
A
.gov website belongs to an official
government organization in the United States.
Secure .gov websites use HTTPS
A lock (
) or https:// means you've safely
connected to the .gov website. Share sensitive
information only on official, secure websites.
The results of GSEA for the OS (a) and RFS (b) prognostic model. The median expression of each LILR gene was used as the cut‐off point, which defined the higher and lower risk groups for the early‐stage PDAC.